IOTA sees a bounce from $0.5 amidst strong downtrend as investors…

Disclaimer: The findings of the following analysis are the sole opinions of the writer and should not be considered investment advice.
Bitcoin saw a bounce from the $37.5k level, and at press time was attempting to push past the $39k mark. This bounce saw the altcoin market post some gains in recent hours as well, and IOTA was one of them. Even though IOTA had heavy resistance in the $0.54 region, bullish sentiment across the market could see IOTA react positively as well.
IOTA- 1 Hour Chart
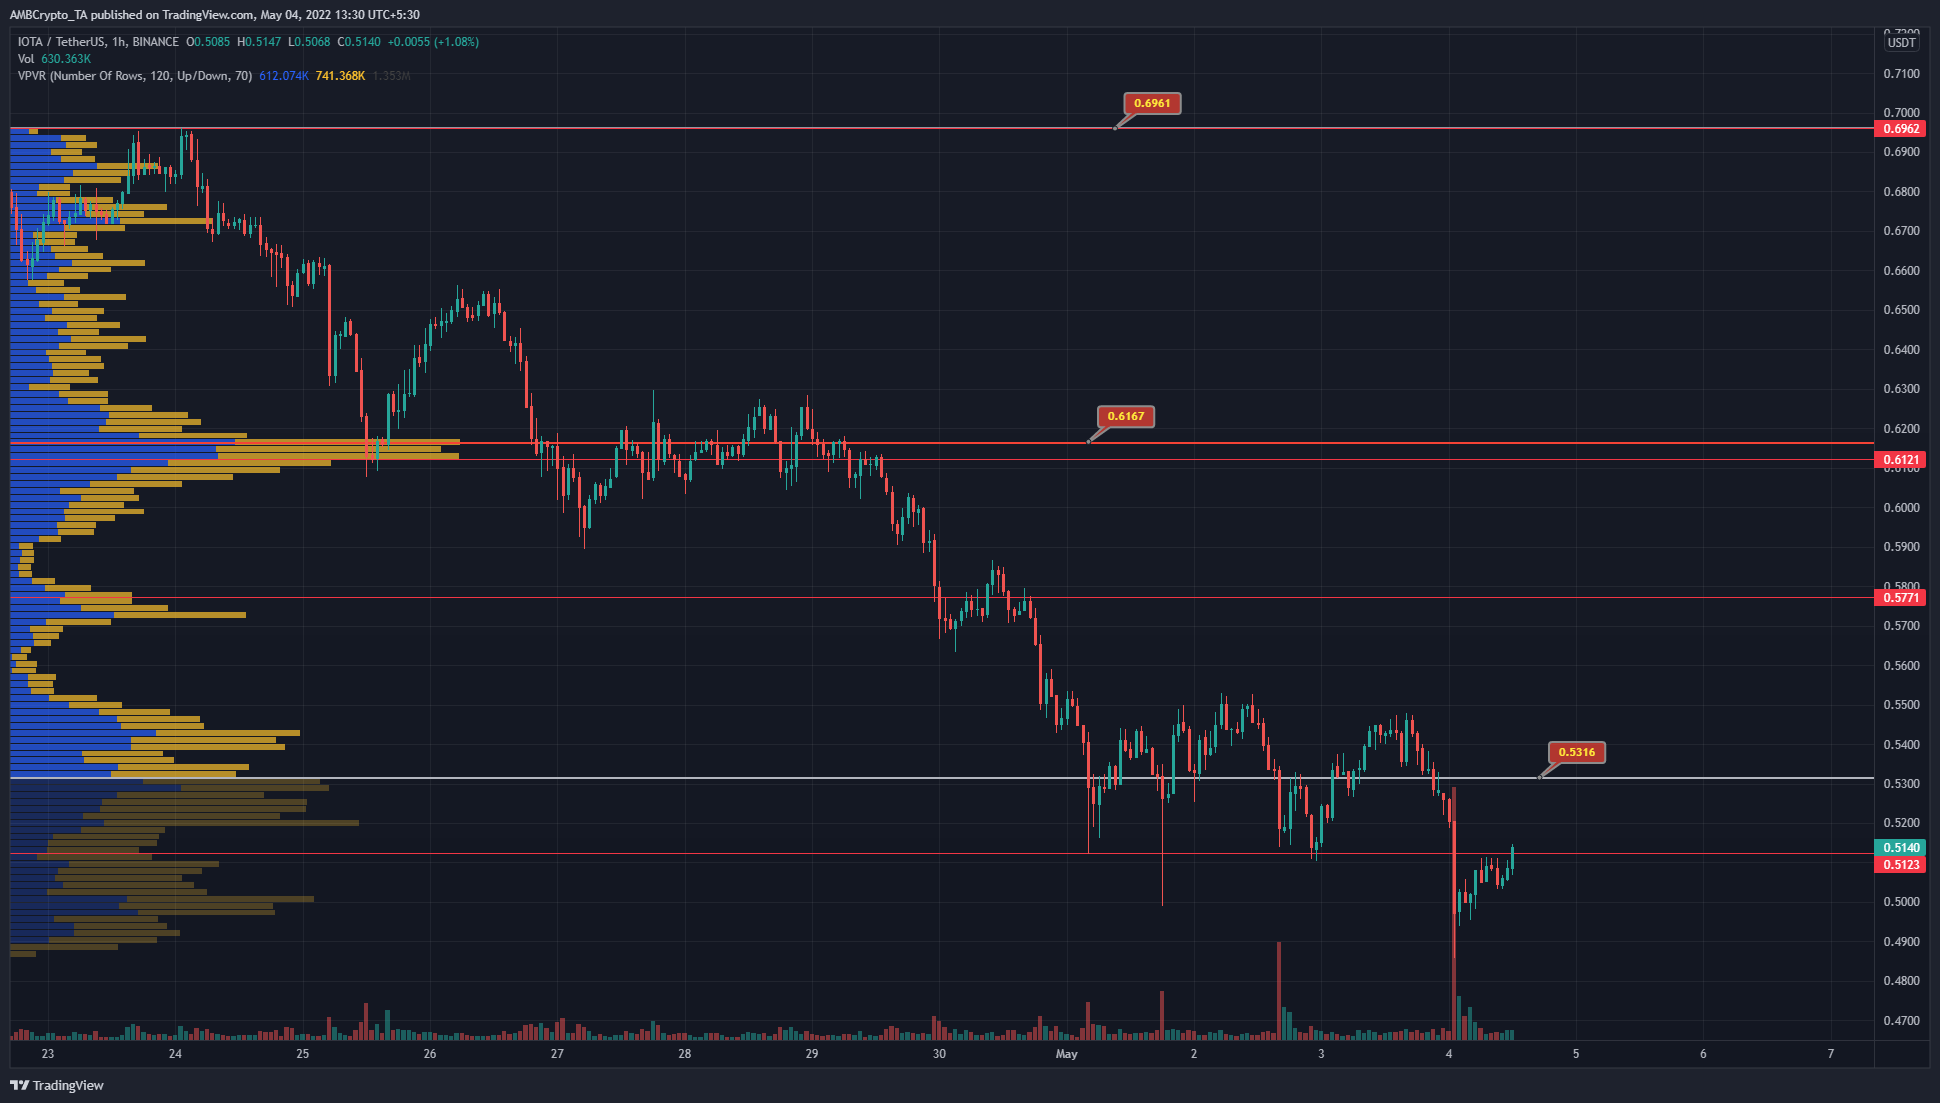
The past ten days of trading were used to plot the Visible Range Volume Profile. This tool showed the Point of Control to lie at $0.616, and the Value Area Lows and Highs at $0.532 and $0.696 respectively. At press time, IOTA was trading below the Value Area Lows at $0.514 and was attempting to close a trading session above the $0.512 level of resistance.
The price has been in a steady downtrend throughout April, but if the price can climb back within the Value Area, it would be a bullish development.
However, the entire zone from $0.52 to $0.54 has had a significant amount of trading volume in the past few days, according to the VPVR. Therefore, IOTA could take some time to reclaim the Value Area Lows.
Rationale
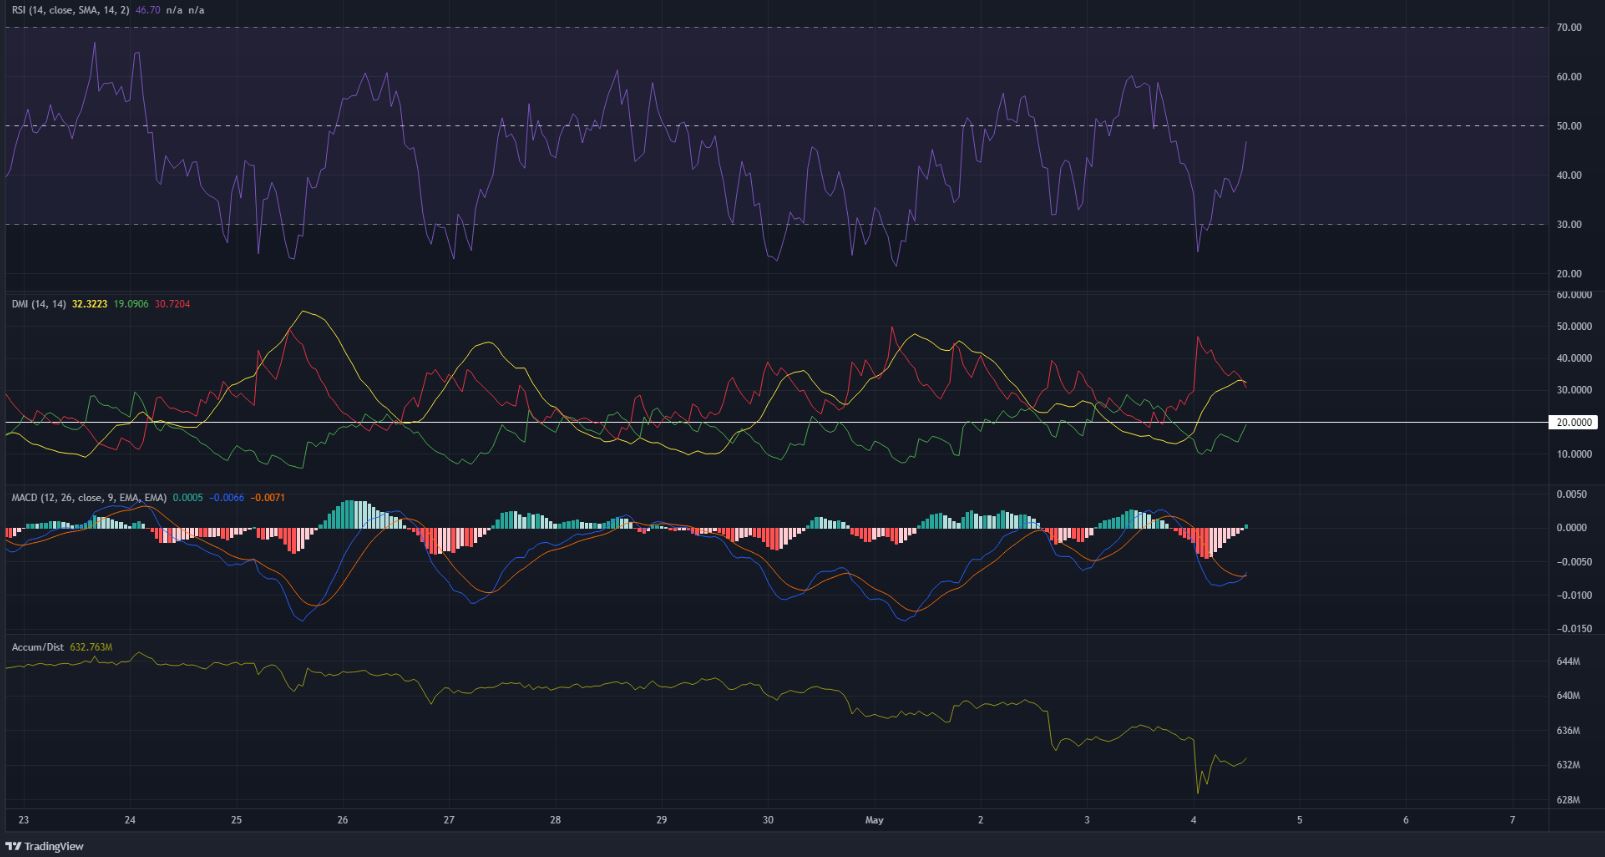
In the past two weeks, the RSI has been below the neutral 50 line for most of the visible range. This suggested that bearish momentum has been predominant. In agreement with the RSI, the DMI also showed a strong bearish trend to have been in progress for the majority of the past ten days. This is evidenced by the ADX (yellow) as well as the -DI (red) lines being above the 20 mark.
Similarly, the MACD also showed bearish momentum to be the stronger force over the last two weeks. However, it appeared to form a bullish crossover to signal the weakening of bearish momentum at press time. In order to reverse the downtrend, the A/D indicator would need to form higher lows to suggest that buyers had begun to wrest control back from the sellers.
Conclusion
If IOTA can climb past $0.54, alongside a corresponding rise in buying volume on the A/D indicator, it could be a sign of intent from the bulls. The $0.553 and $0.549 levels would need to be beaten to signal a shift in market structure toward a bullish bias.


