Is Bitcoin losing market traction or gaining momentum?

Bitcoin is one of the biggest store of value assets existing at the moment. Naturally, it also becomes the point of focus for the majority. While in most cases such attention would be for the better of the coin, in the case of BTC, the last few months have been rather unpleasant. In the span of 2 months, BTC rallied to its ATH above $60k and also crashed back down to $33k. At the time of writing the Bitcoin was trading at $38,759.
What about investors?
That is exactly what needs to be addressed as short-term metrics and community sentiment at present seem bullish for Bitcoin. It is necessary to observe long-term metrics and understand price movements.
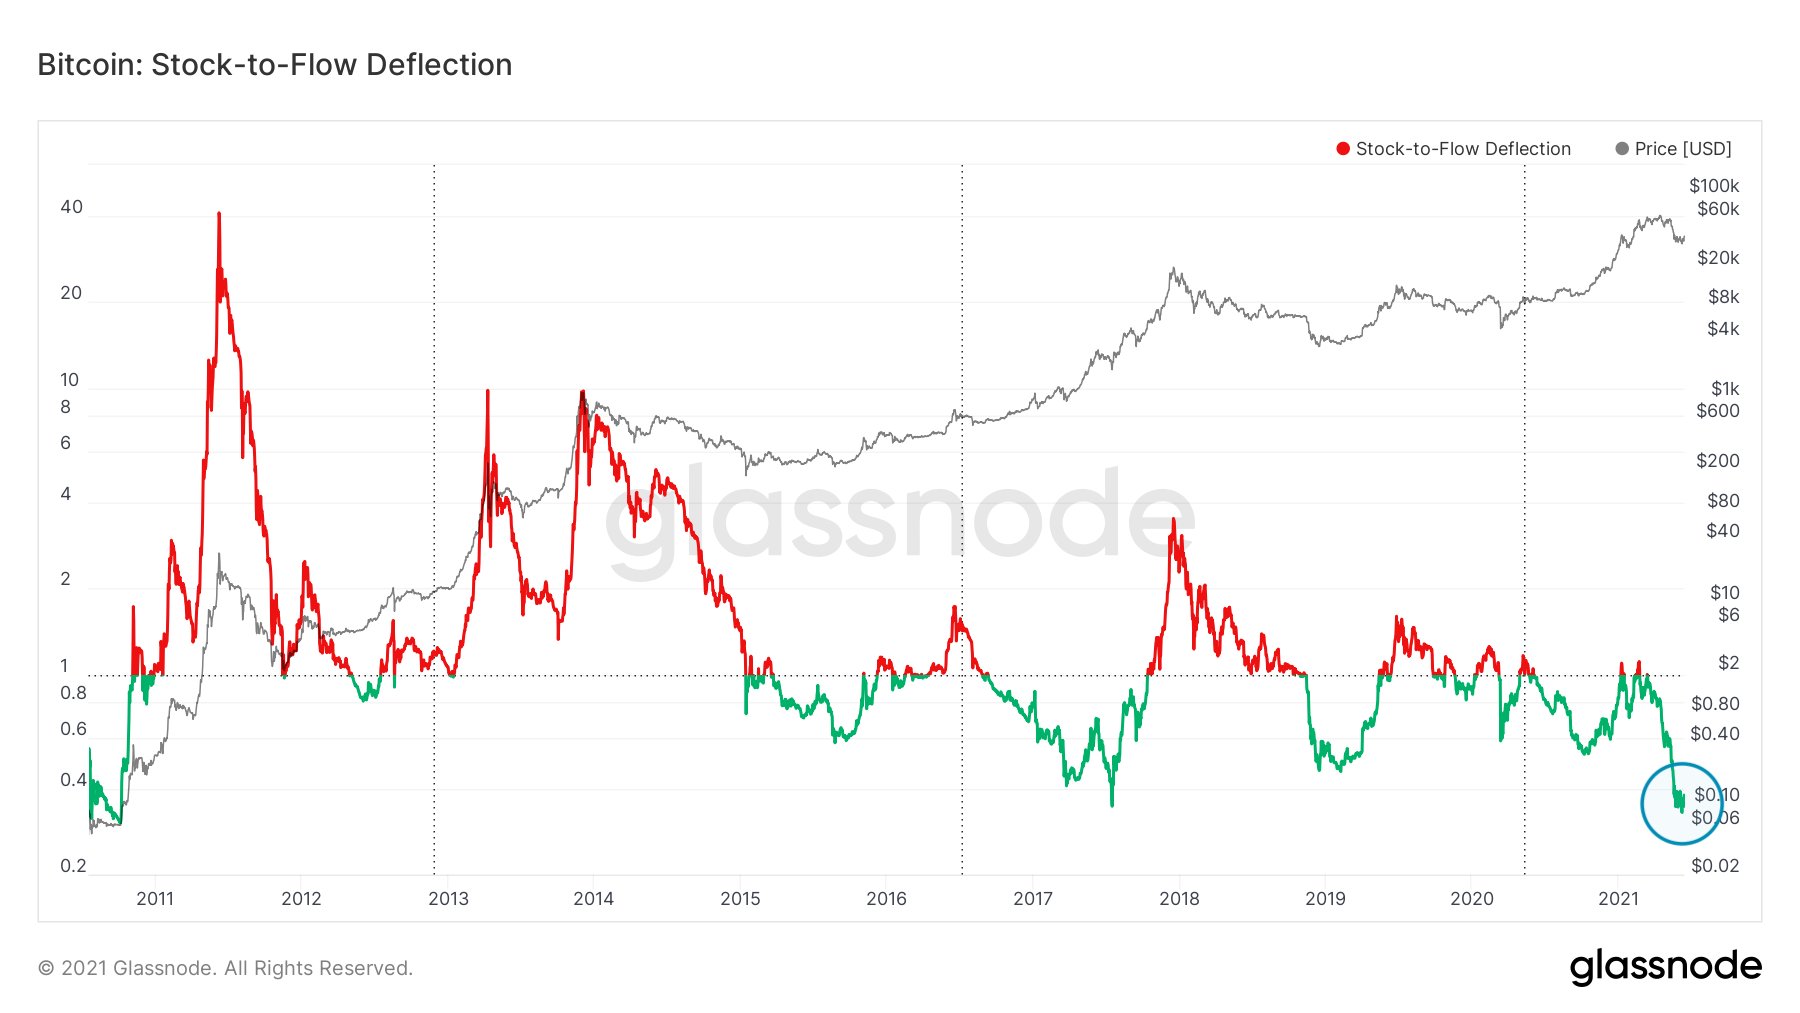
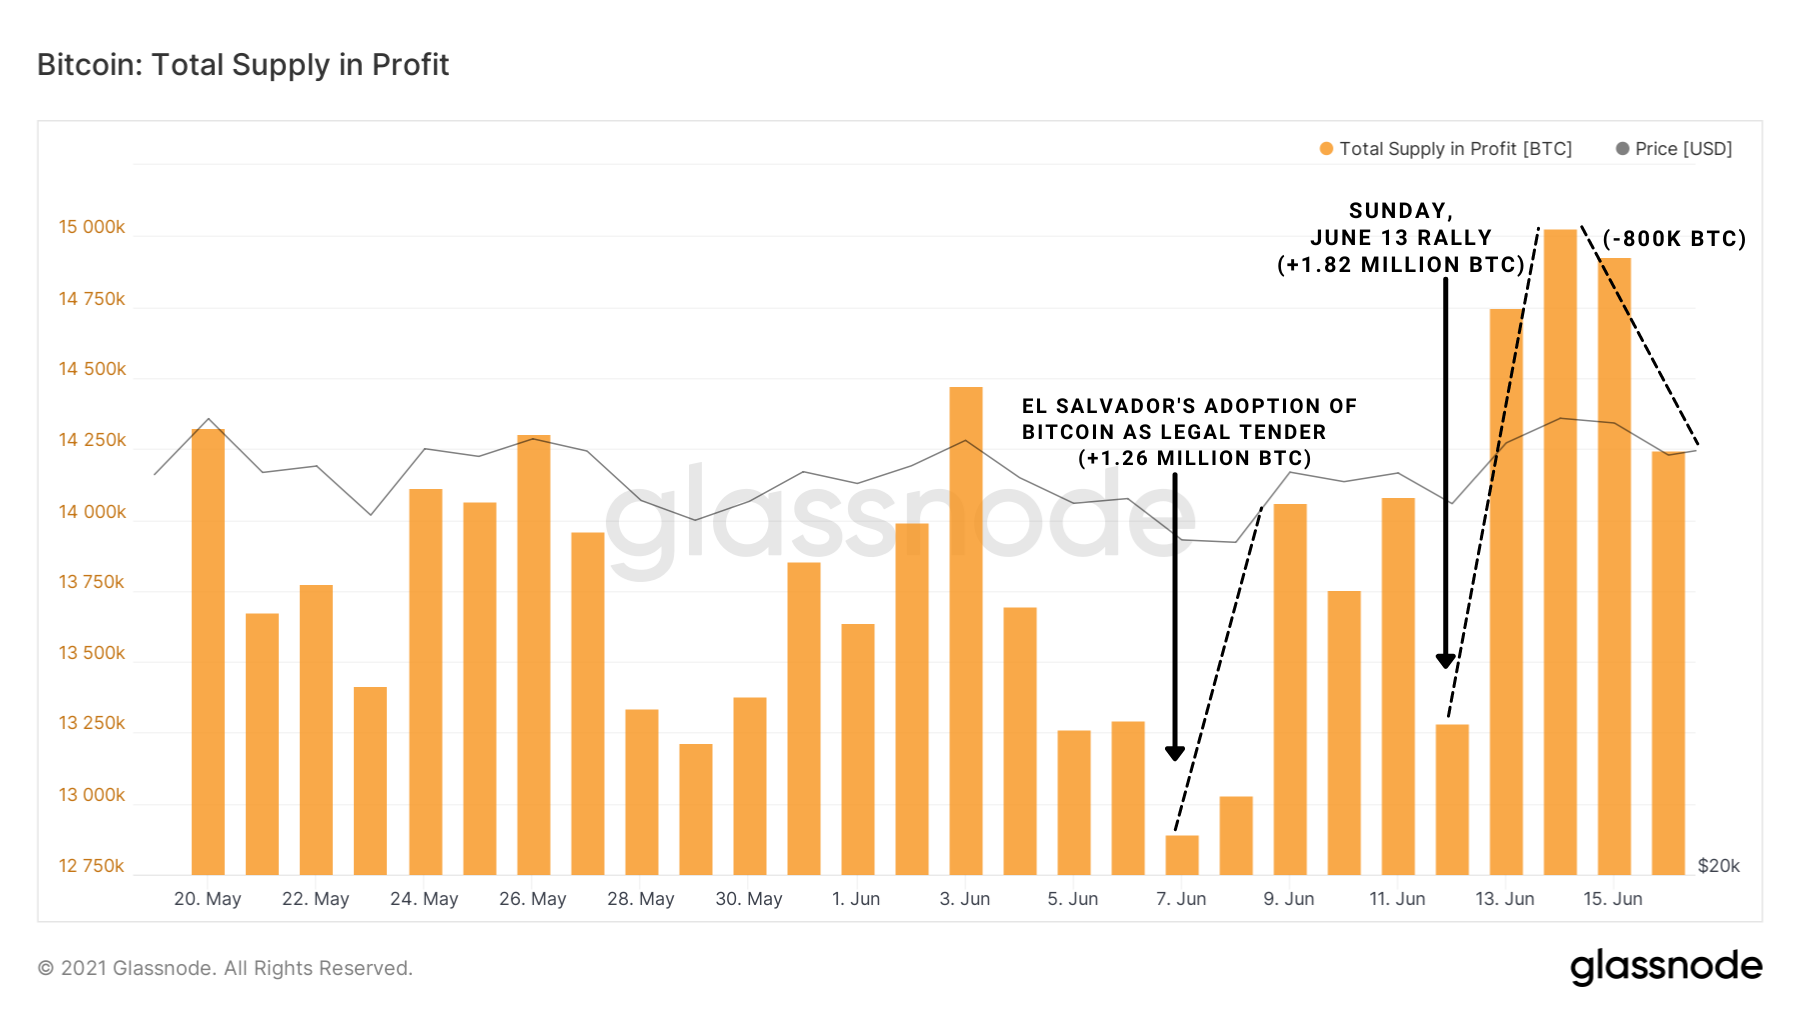
According to the Stock-to-Flow Deflection model, presently Bitcoin is quite undervalued as the negative deflection on the model has been the highest ever. Similarly, BTC’s total supply in profit has jumped twice in the last 10 days. First owing to El Salvador’s adoption on June 8 and the second time during the Sunday, June 13 rally. Furthermore, Microstrategy just announced the sale of $1 billion of its shares in order to acquire more Bitcoin. This comes just a few days after the company finished its $500 million funding round which was already targeted towards purchasing Bitcoin.
Is it about to rain money?
No. While all of this sounds pretty convincing that BTC will provide huge ROIs, one should remember that all that glitters is not gold, or digital gold in this case. In the long-term analysis, BTC has been performing rather weakly. The coin has set record lows in:- ( As of June 16 )
- Exchange Outflow Volume – 17-month low of 1,255.315 BTC.
- Miners Outflow Volume – 5-month low of $1.72 million.
- Miners’ Outflow Volume – 1-month low of 47.163 BTC.
Even BTC’s profitable supply fell down as soon as the Sunday rally came to an end (ref. Total Supply in Profit chart). At the time of writing, Bitcoin’s price movement displayed very clear signs of a downtrend (White dotted line of Parabolic SAR forming above the candlesticks). More so, a bearish crossover has been dominating MACD indicator on the 4-hour chart.
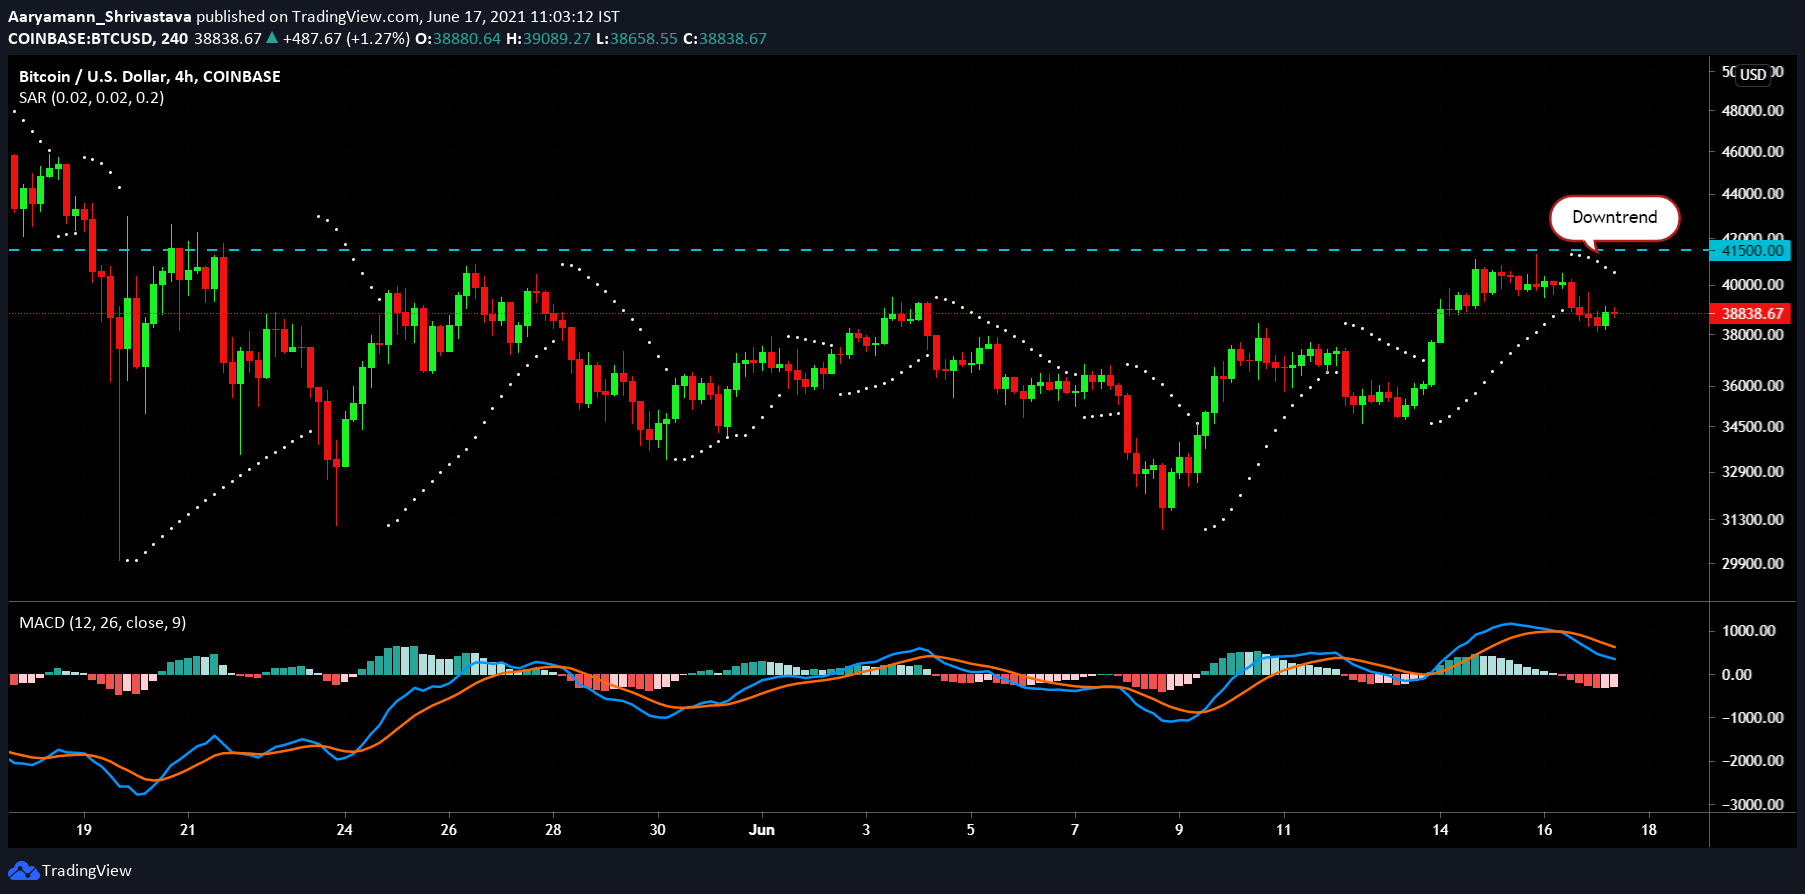
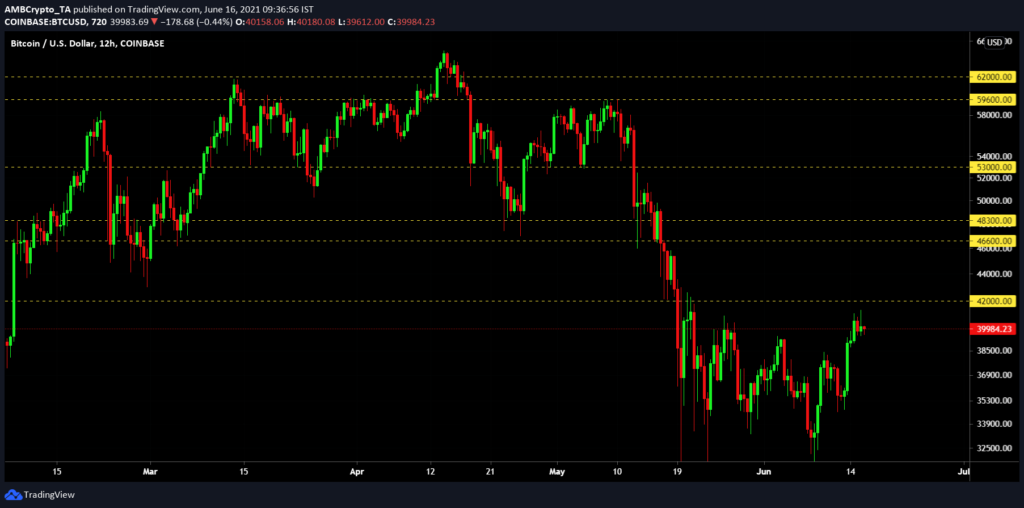
All these indicators show that for the while Bitcoin will remain consolidated under the $41,500 resistance level. Besides, the coin has way too many resistance levels to break in order to get close to its ATH. Thus, investors should be wary about any immediate investment as they may not gain back as much ROI as they expect.


