Litecoin, Binance Coin, Tezos Price Analysis: 26 September

The broader market flashed a sell-off yet again, forcing many altcoins to dip on their respective charts. The likes of Litecoin, Binance Coin and Tezos were no exception either. Litecoin at its current price level was trading close to its one-month and a half-price mark.
Binance Coin declined by 6.7% as it fell through its immediate support level. Lastly, Tezos met with a declining buying strength, but showed chances of a price turnaround if the RSI manages to remain above the half-line.
Litecoin (LTC)
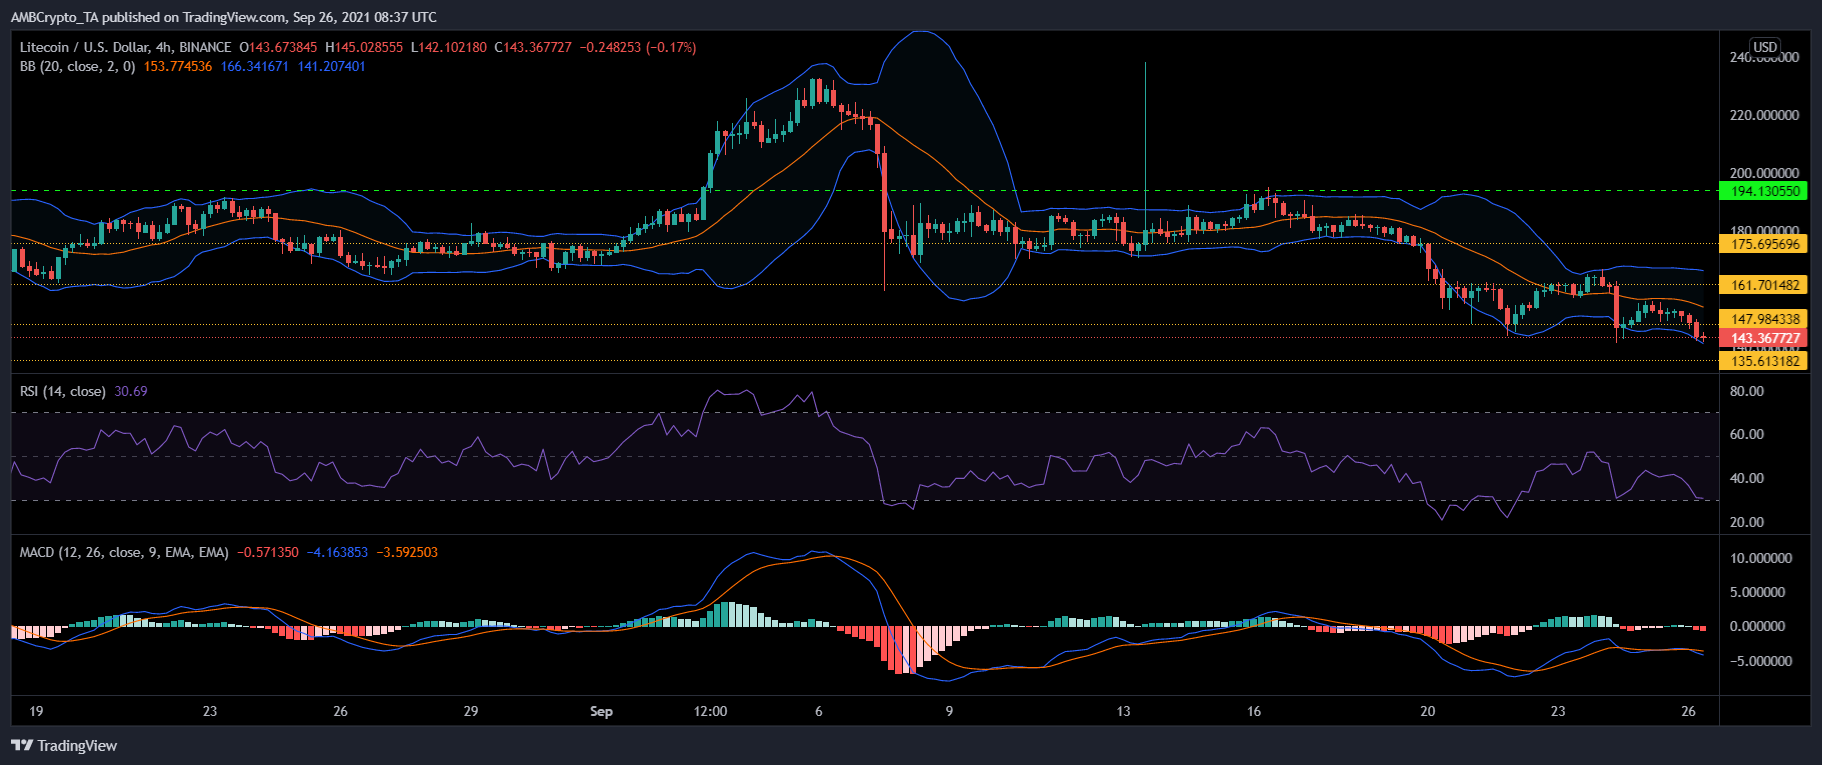
Litecoin depreciated 3.85% over the last 24 hours and was trading at $143.36, which the coin last traded around a month and a half back. The nearest support for the coin stood at $135.61. The parameters of the coin pointed towards negative price action as Litecoin met with yet another sell-off over the last 24 hours.
Relative Strength Index was near the oversold zone, threatening to fall beneath it. MACD had displayed a bearish crossover and red bars on its histogram. Bollinger Bands diverged, which suggested that price volatility might see a rise over upcoming trading sessions.
On the flip side, Litecoin’s prices could encounter resistance at $147.98 and then at 161.70, provided buying strength resurfaced in the market. Other additional price ceilings for the coin stood at $175.69 and $194.13, a price mark LTC traded at around a week back.
Binance Coin (BNB)
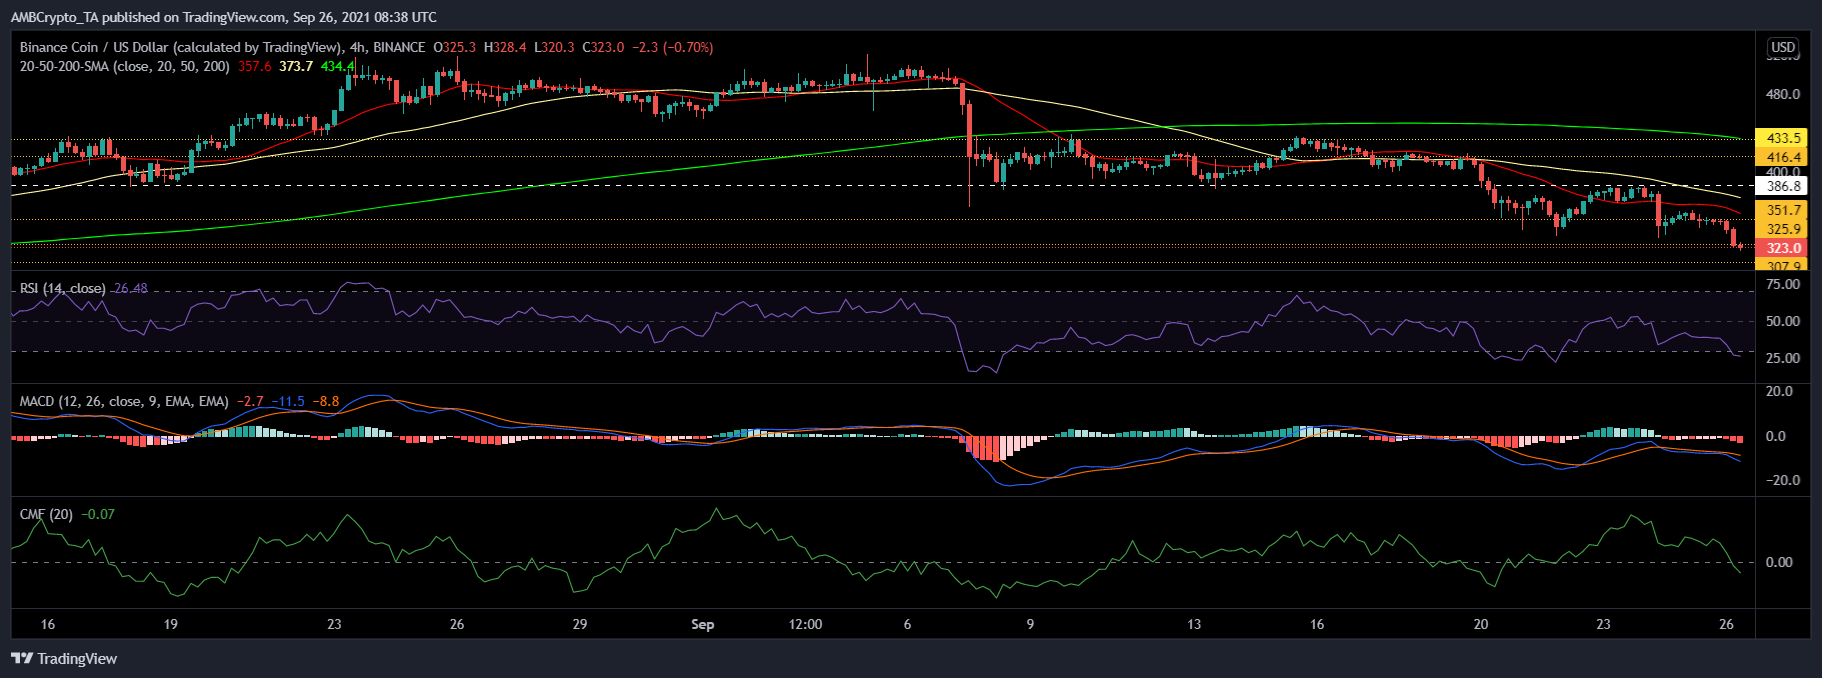
Binance Coin went south by 6.7% over the last 24 hours and was valued at $323.0. The coin recently was unable to sustain prices above its $325.9 support region, the next support line was at $307.9. BNB’s price was below the four-hour 20-SMA, which indicated that price momentum was in inclination with sellers.
The Relative Strength Index was in the oversold zone signifying that buying pressure had fizzled out. MACD displayed red bars on its histogram as it had observed a bearish crossover. Chaikin Money Flow was below the mid-line which pointed towards low capital inflows. The indicator was at this level around a week ago.
In case of a price reversal owing to a recovering of buying strength, the immediate resistance that the coin could witness stood at $351.7 and at its one-week high of $386.8. Other price ceilings were at $416.4 and $433.5.
Tezos (XTZ)
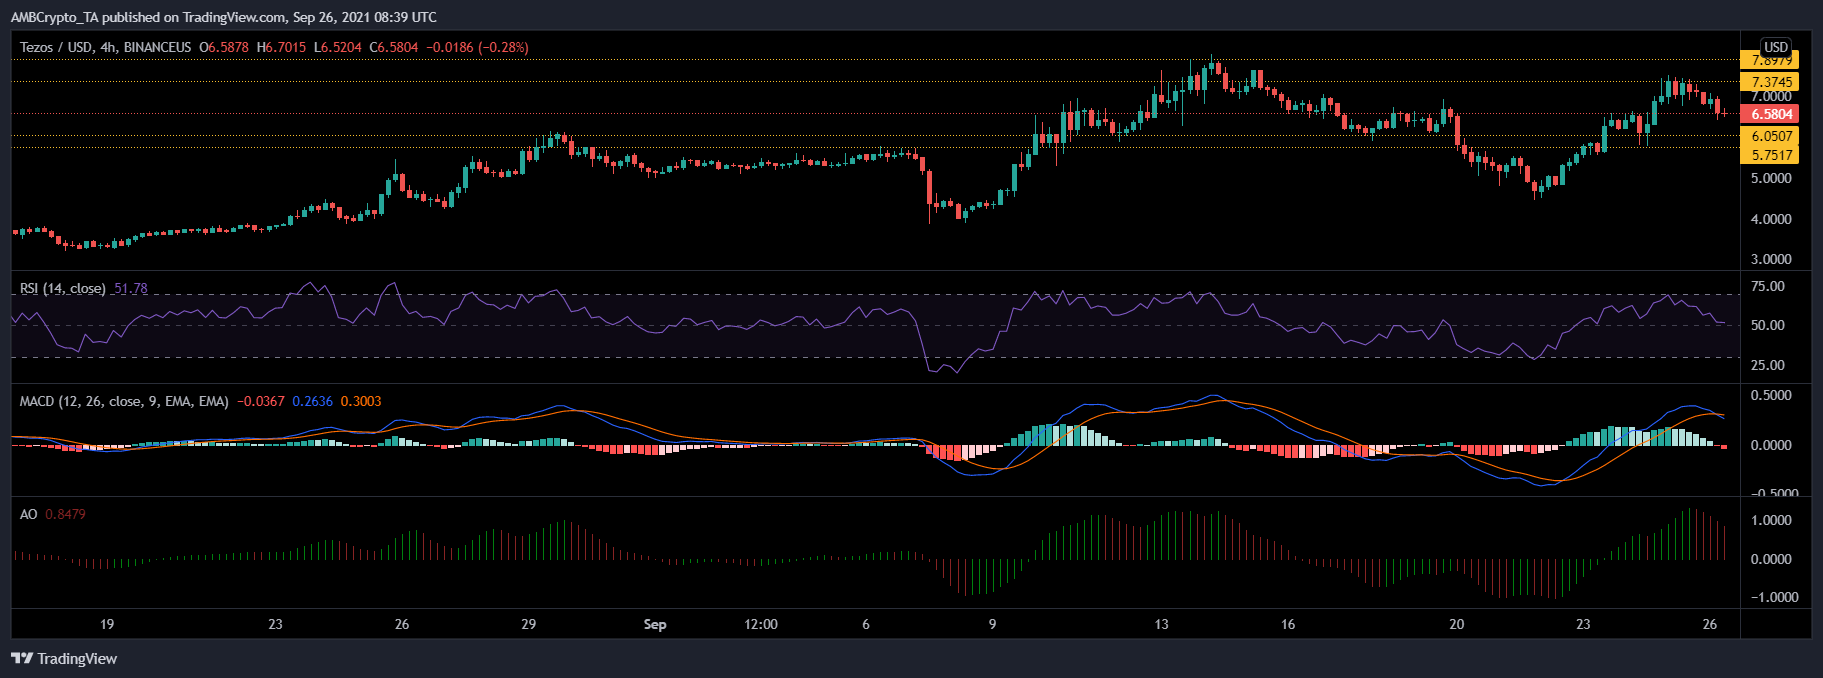
Tezos was trading at $6.58 as it recorded a loss of 3.5% over the last 24 hours. The nearest price floor stood at $6.05 and then at $5.75. Parameters showed that bearish pressure was setting into the market.
The Relative Strength Index threatened to fall below the 50-mark as it was trading on top of it. MACD displayed red bars on the histogram after witnessing a bearish crossover. Awesome Oscillator also flashed tall red signal bars indicating bearish price action.
If RSI manages to remain above the half-line, then prices could depict northbound movement. In the case of which, immediate overhead resistance was at $7.37 and $7.89 respectively.


