Litecoin, Ethereum Classic and Polkadot Price Analysis: 16 August

Altcoins Litecoin, Ethereum Classic and Polkadot, all rose on their charts over the last 24 hours, owing to Bitcoin and Ethereum’s northbound movements. LTC held itself above its support region of $175.35 as it logged a 2.5% increase in prices, ETC eyed its immediate resistance of $76.70 as it traded at $75.44. DOT shot up by 8.1% as it recorded a multi-month high.
Litecoin (LTC)
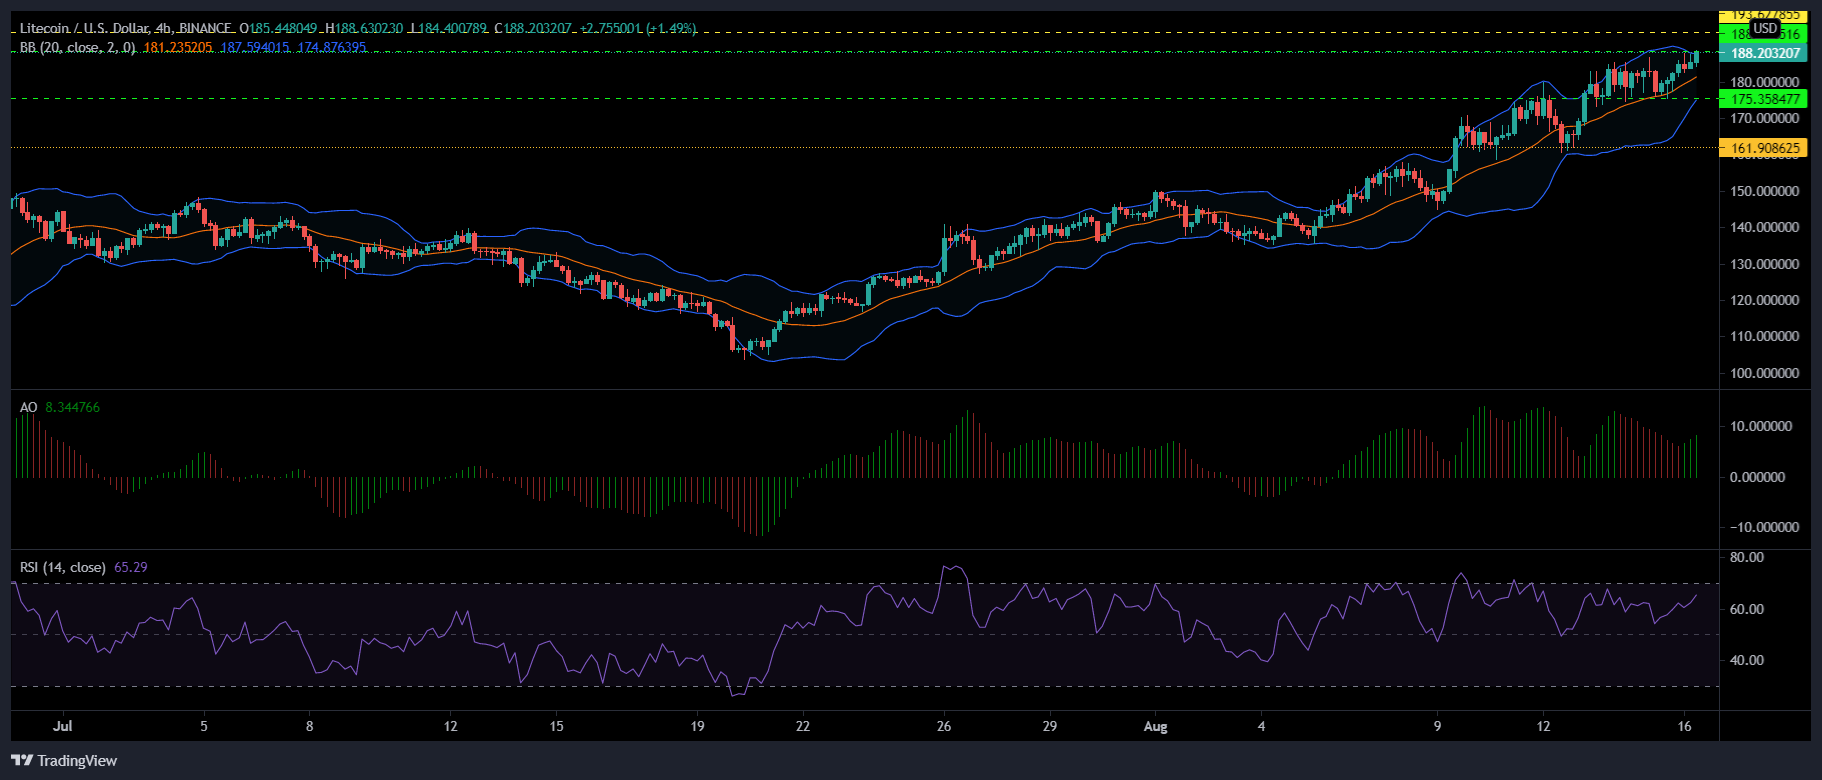
Litecoin climbed up on its chart by 2.5% as it was trading at $188.20. The coin traded successfully over its support region of $175.35 and could potentially topple over its immediate resistance of $188.90 to touch the next ceiling of $193.62.
Awesome Oscillator flashed green signal bars suggesting bullish price action for LTC. Relative Strength Index noted an increase in buying pressure while it stood above the 60-mark.
Bollinger Bands constricted implying that market volatility could be on the decline. In case of a dip in prices, Litecoin could fall to the $175.35 support line.
Ethereum Classic (ETC)
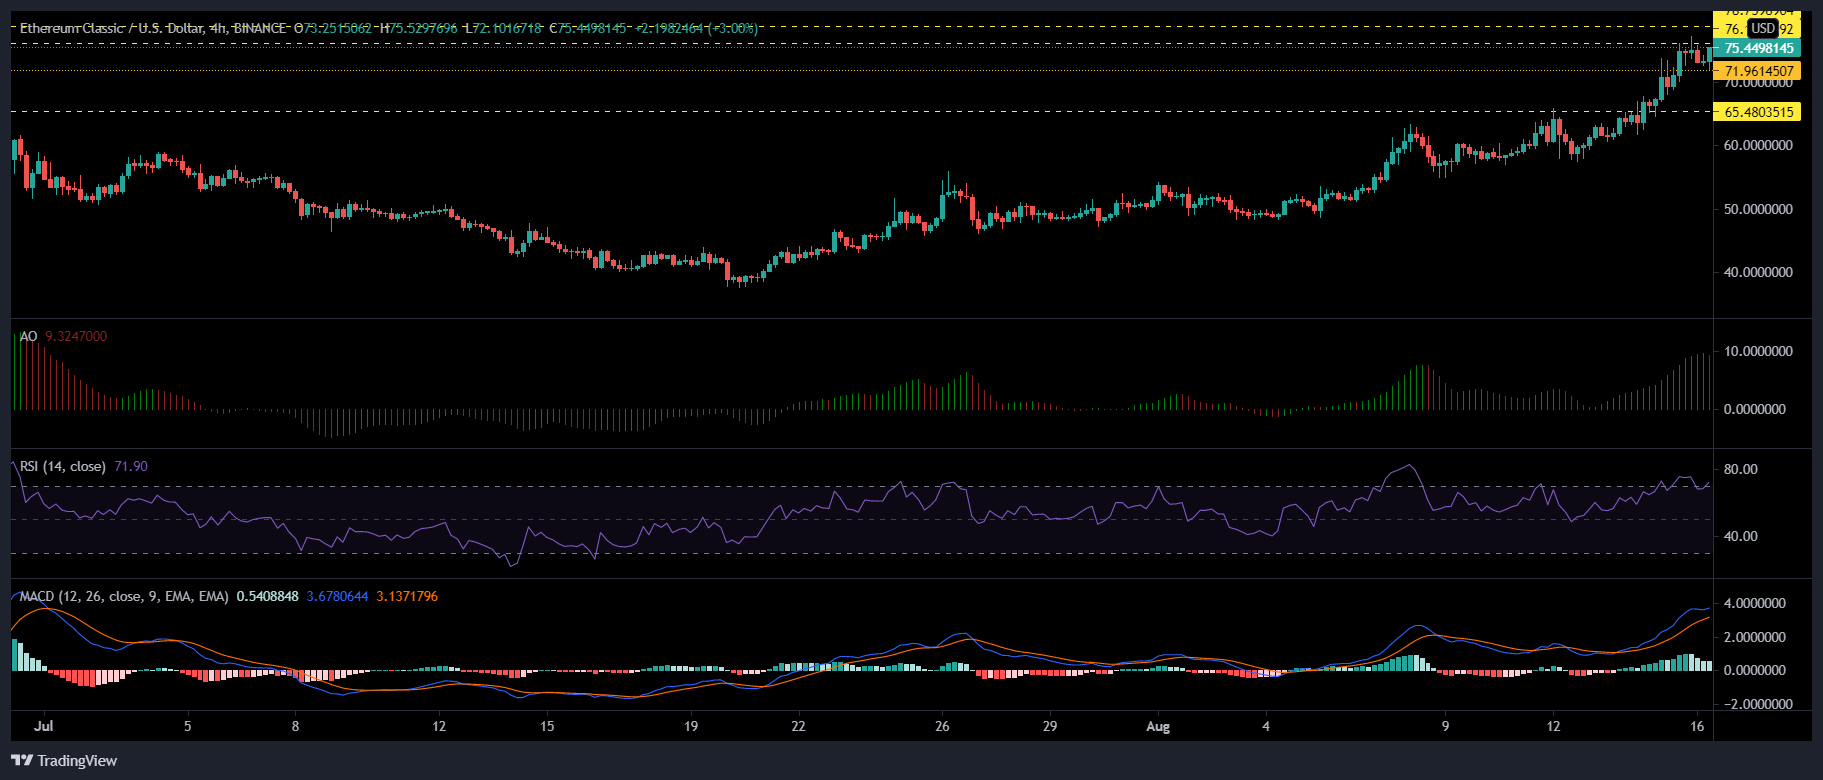
ETC noted a 2.1% increase over the last 24 hours as it stood at a multi-month high of $75.44. If ETC rises above the current price level, then it could test the $76.70 resistance.
The four-hour chart of ETC, however, showed mixed signs. The Awesome Oscillator noted the onset of a bearish price movement with a green signal bar over the midline.
MACD displayed green histograms albeit declining in nature, so ETC could possibly dip and stand on the $71.96 support level.
The Relative Strength Index remained bullish as it was seen within the overbought territory, a reading that is often mostly followed by a corrective pullback.
Polkadot (DOT)
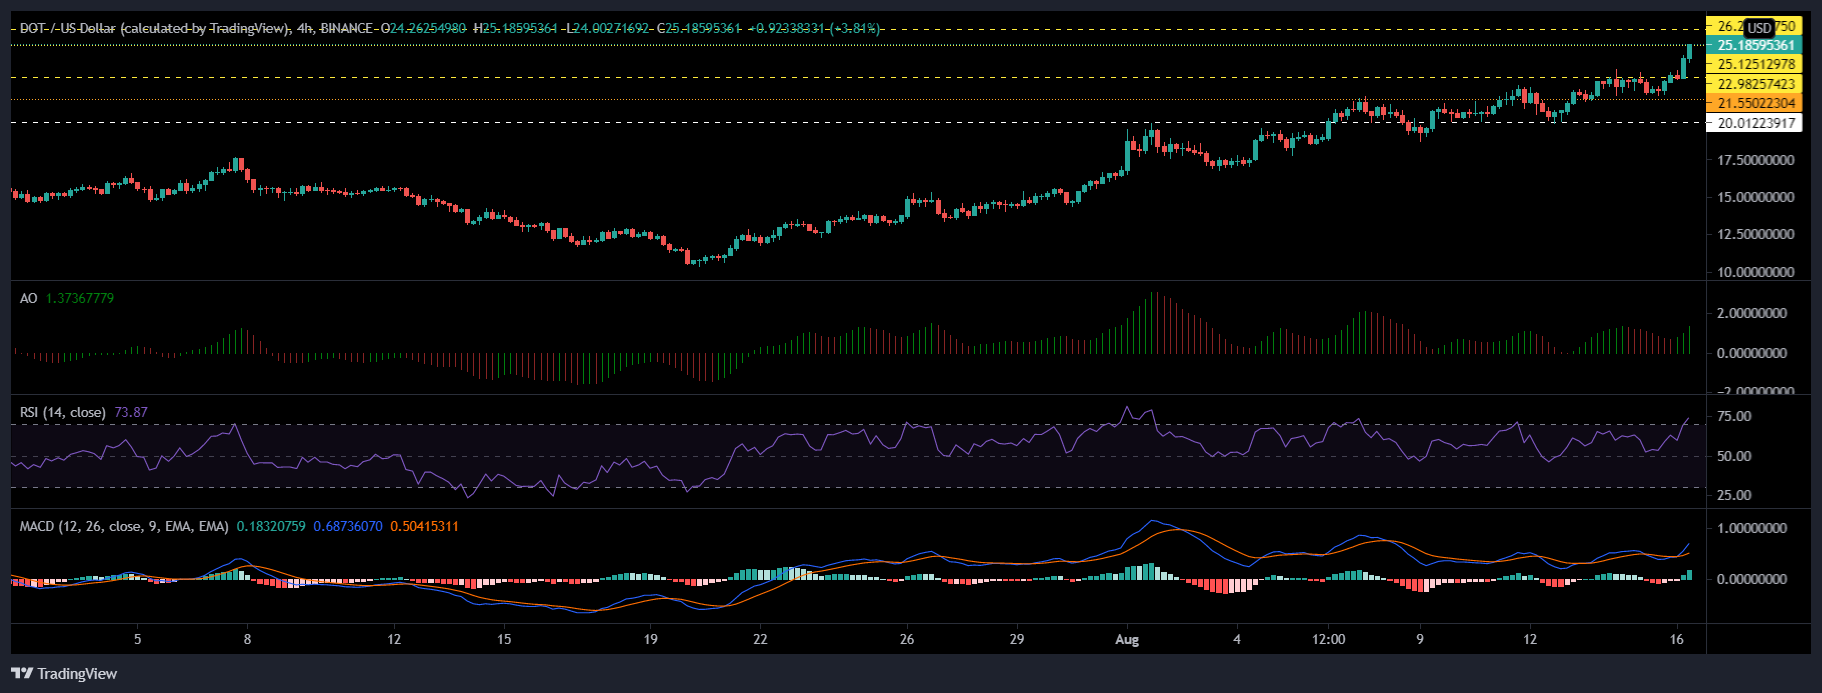
DOT registered an impressive 8.1% surge over the last 24 hours, as it traded at $25.18, a price it last touched on 14 June. As technical indicators point towards a bullish momentum, DOT could maintain the uptrend and test $26.29 resistance.
Awesome Oscillator observed green signal bars which indicated an uptrend in the market. Corresponding to the same, MACD after recording a bullish crossover also displayed the onset of green bars on the histogram.
Relative Strength Index went straight into the overbought zone as buying pressure hiked, however, a chance of price reversal can’t be ruled out completely. In case of a reversal, DOT could trade on the $22.98 support level.