MATIC, Polkadot, Ethereum Classic Price Analysis: 31 May

Volatility across alts such as MATIC, Polkadot and Ethereum Classic remained low as Bitcoin traded below $38,000. However, these alts held on to key support marks and prepared for their next leg upward.
MATIC
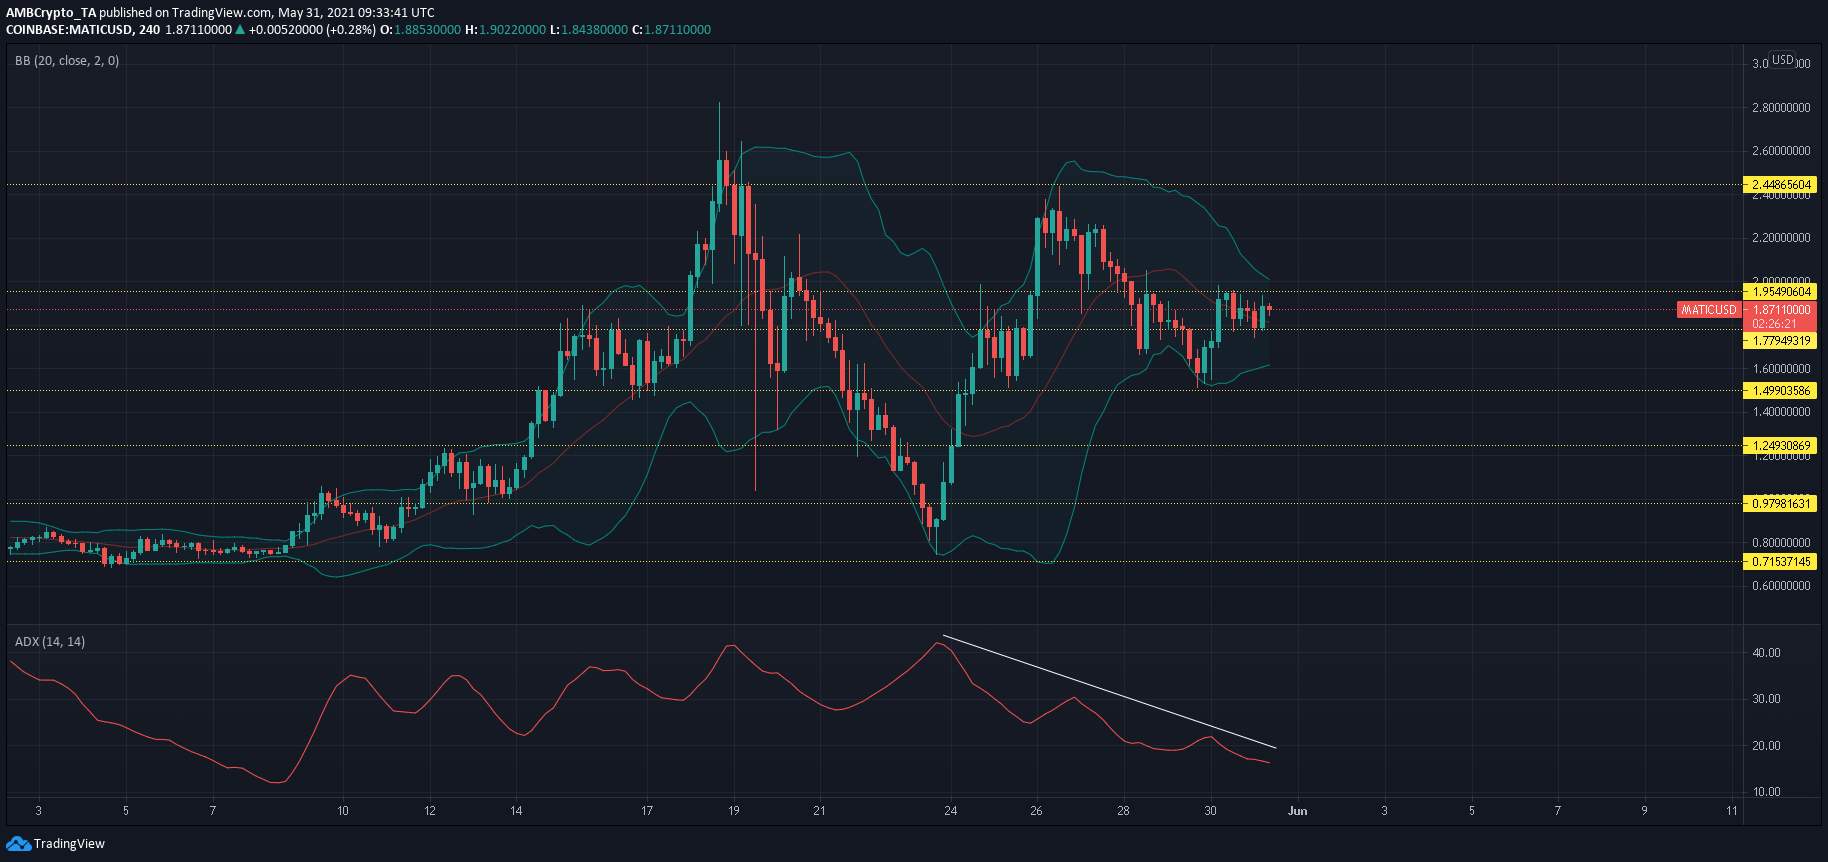
MATIC largely traded at the helm of $1.95 resistance over the past few sessions. ADX’s downtrend suggested that the market was becoming less directional and a strong trend was dissipating. Moreover, converging nature of Bollinger Bands highlighted low volatility in the current price level. These factors pointed towards a consolidation phase over the next few sessions. During this period, expect MATIC to mainly oscillate between $1.49 and $1.95
While buying on support and selling on resistance could be a viable trade strategy, the ‘wait and watch’ strategy would be a safer bet in a rangebound market.
Polkadot [DOT]
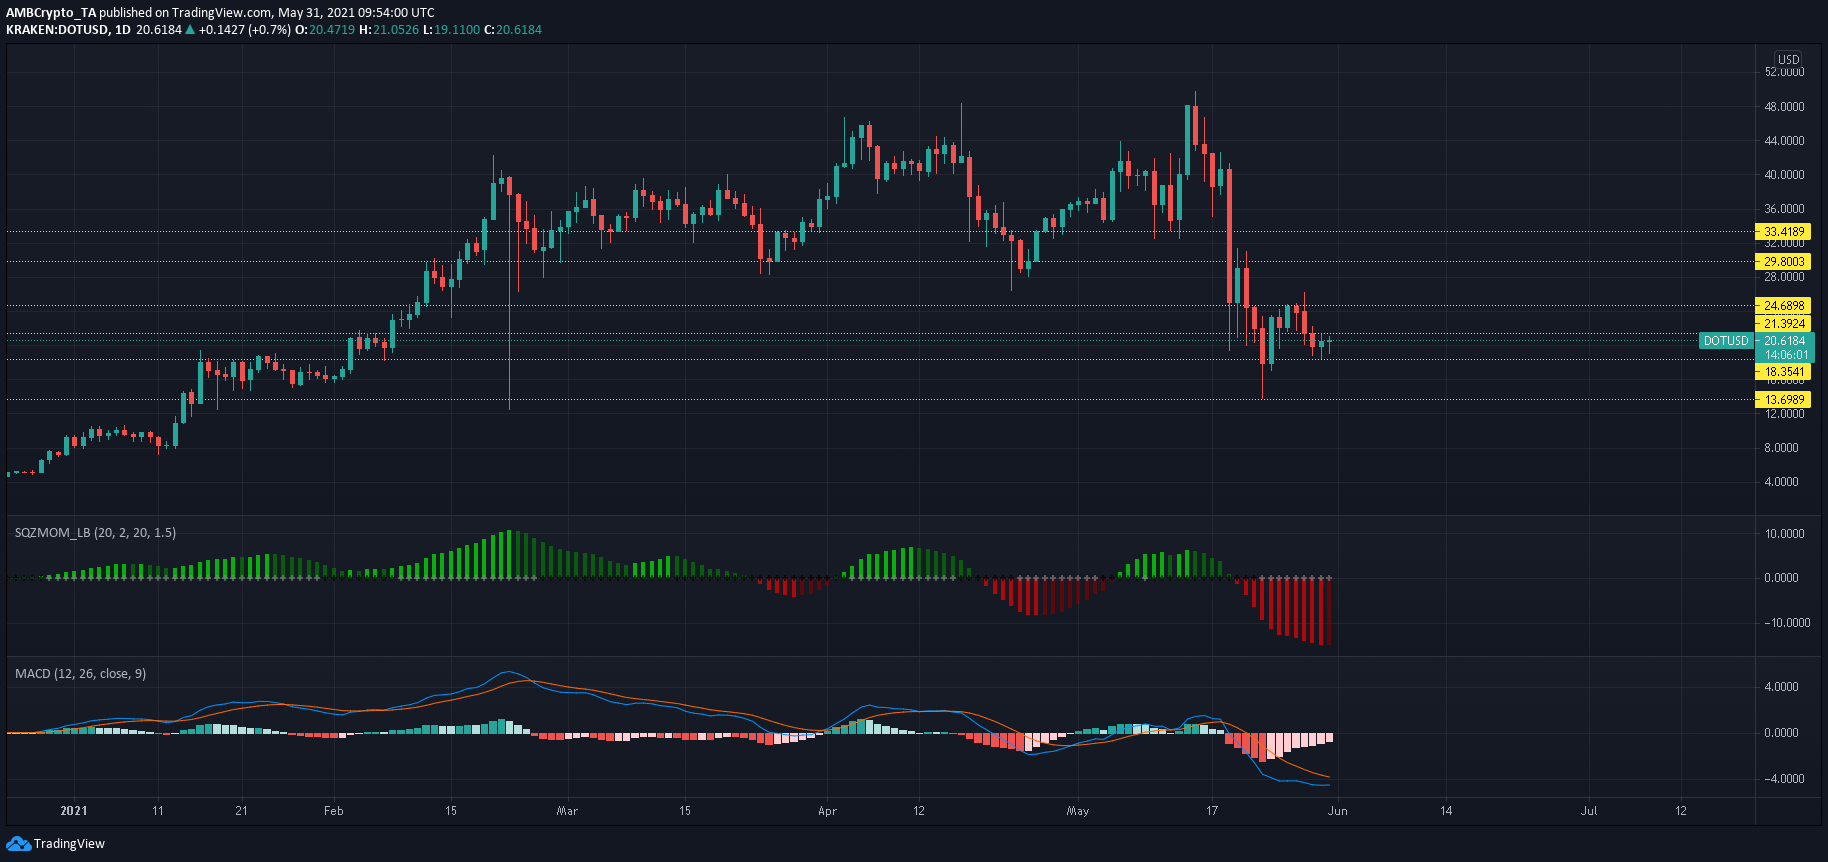
Squeeze Momentum Indicator when applied on Polkadot’s daily chart showed that bearish pressure was yet to dissipate. However, a series of light red bars would indicate some buying resurgence. This would likely be the case over the coming days as DOT prepares for its next upswing. Until then, minor movements might be observed in the DOT market. A rise above $21 could see DOT test its ceiling at $24.6. Conversely, losing out on $18.35 support could allow for a retest of $13.7-support.
MACD closed in on a bullish crossover- a development that would likely deny an extended sell-off. Even the histogram noted weakening bearish momentum.
Ethereum Classic [ETC]
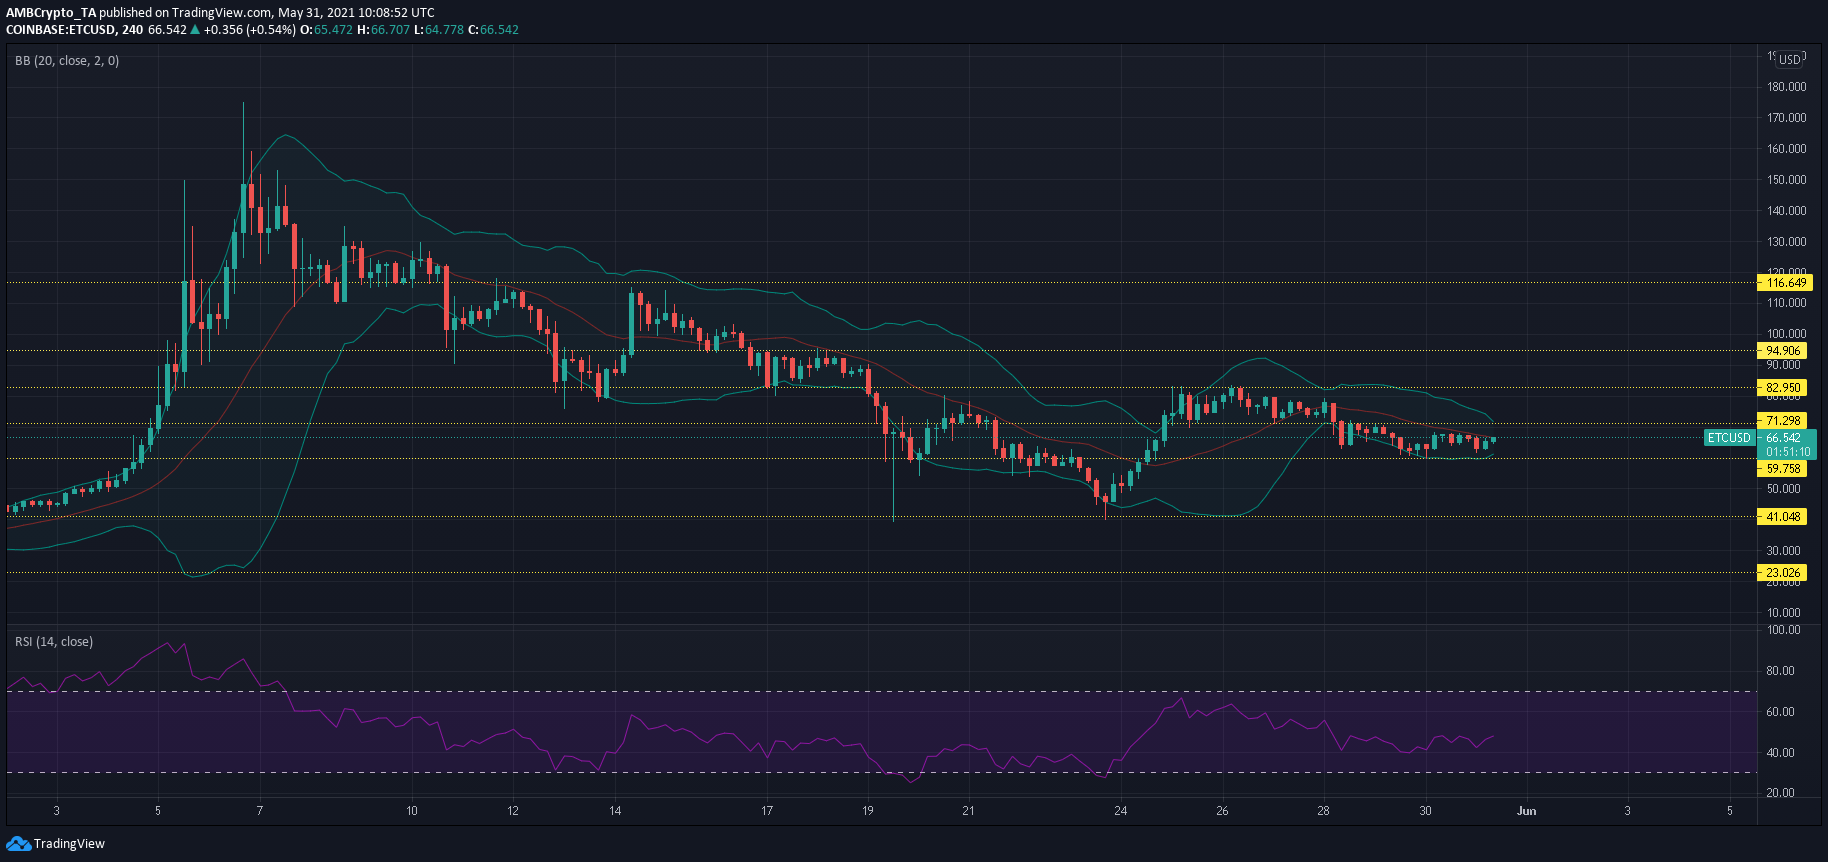
Short-bodied candlesticks on Ethereum Classic’s 4-hour chart represented a period of consolidation for the world’s 19th largest cryptocurrency. Bollinger Bands remained constricted as volatility was low. This disallowed large price swings over the shorter term. For minor gains, a breakout above $71.3 could see a rise to $82.95-resistance. RSI also maintained neutral territory and moved between 40-50.
Once a breakout occurs, a break above $94 could trigger a price hike towards early-May highs.