Monero, NEM, ATOM Price Analysis: 08 September

As Bitcoin’s prices received a massive blow owing to the legal tender fiasco in El Salvador, the altcoin market seems to have been severely affected. Monero, NEM and COSMOS plunged on their respective charts. XMR traded at its multi-week low price after a 16.2% decline. XEM was parked below its month-long support line of $0.184, while ATOM crashed by 25.2% over the last 24 hours.
Monero (XMR)
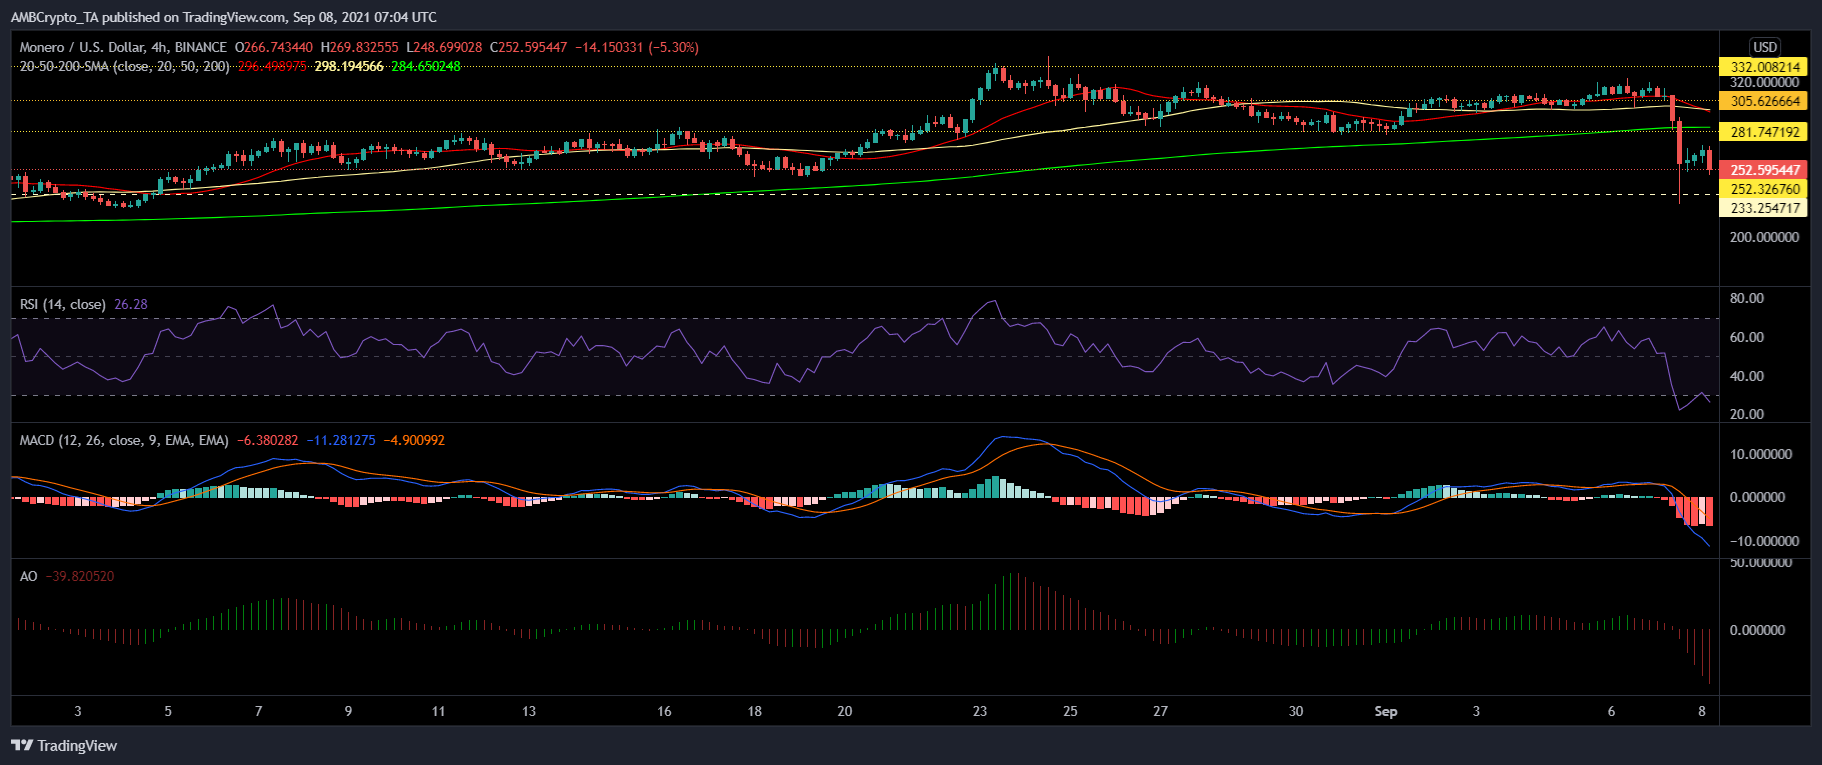
Monero’s price plummeted 16.2% over the last 24 hours and was seen trading at $252.59 This particular price point was the three-week low for the altcoin. Monero’s candlesticks remained under the 4-hour 20-50-200 SMA, indicating that the momentum belonged with the sellers.
Other indicators remained extremely bearish. On further move downwards, the coin can find support on $252.32, which the coin hasn’t dipped below for over a month. Relative Strength Index threatened to dip into the oversold territory, the indicator was on a multi-month low.
Additionally, MACD displayed tall red bars on its histogram while Awesome Oscillator flashed red signal bars. In case, buying pressure revives, XMR might attempt to topple over the $281.74 resistance mark. Other levels stood at $305.62 and at the multi-month high of $332.
NEM (XEM)
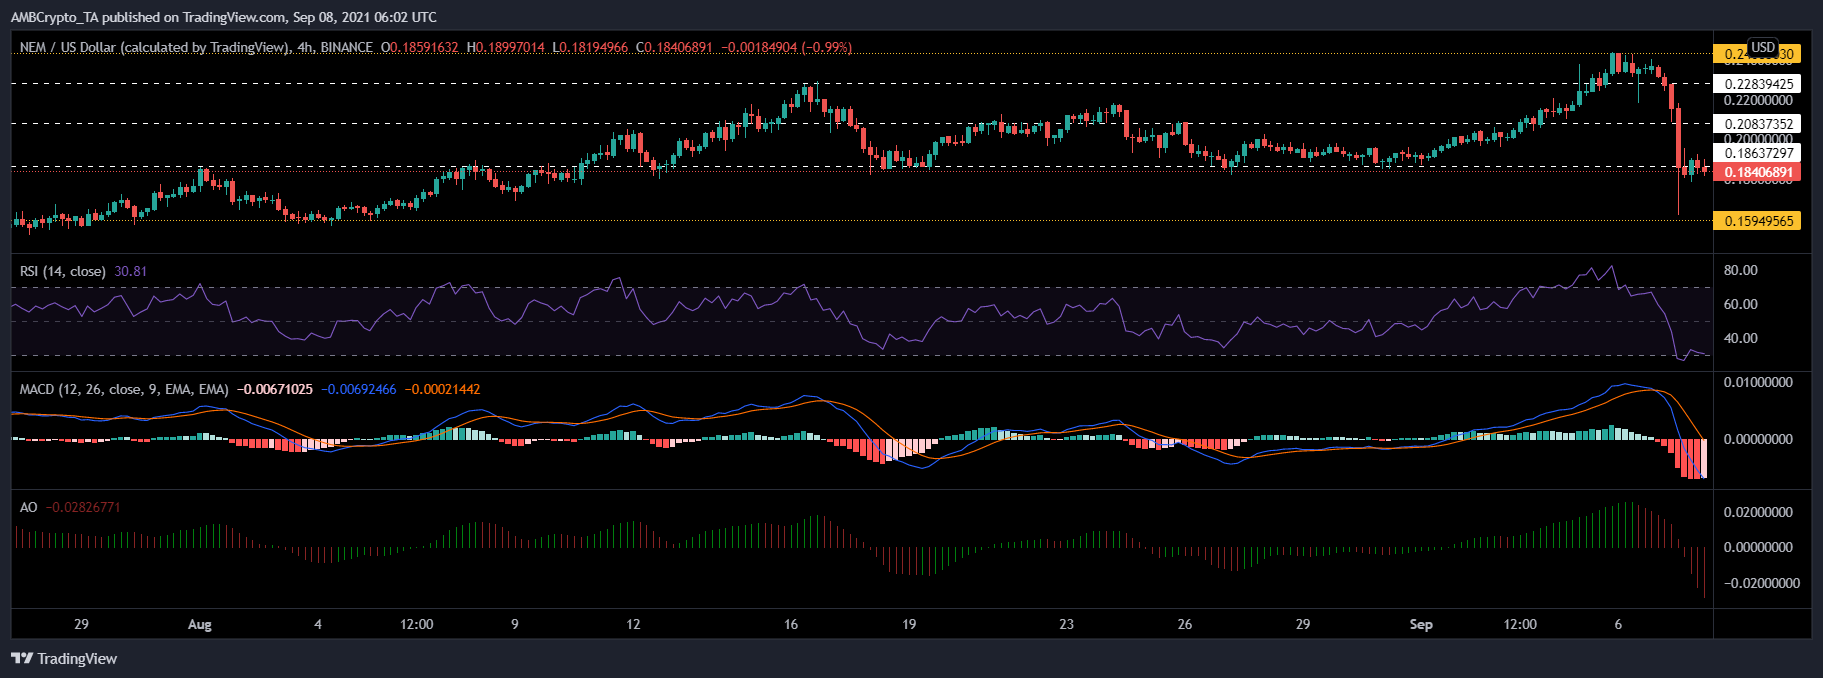
XEM plunged by 20.2% over the last 24 hours and was priced at $0.186. The coin recently broke below its almost month long-standing support line of $0.184. With a further bearish push, the altcoin will trade near the $0.159 price line. The token hasn’t traded below the aforementioned support line in over a month’s time.
MACD showed red bars on the histogram and Awesome Oscillator also displayed red signal bars. Relative Strength Index stood in the bearish zone, after selling pressure declined slightly. All three indicators were on a multi-month low.
If buying pressure starts to find its way back to the market, the coin can head up to topple over the $0.208 price mark. Additional resistance lines stood at $0.228 and then at $0.249.
Cosmos (ATOM)
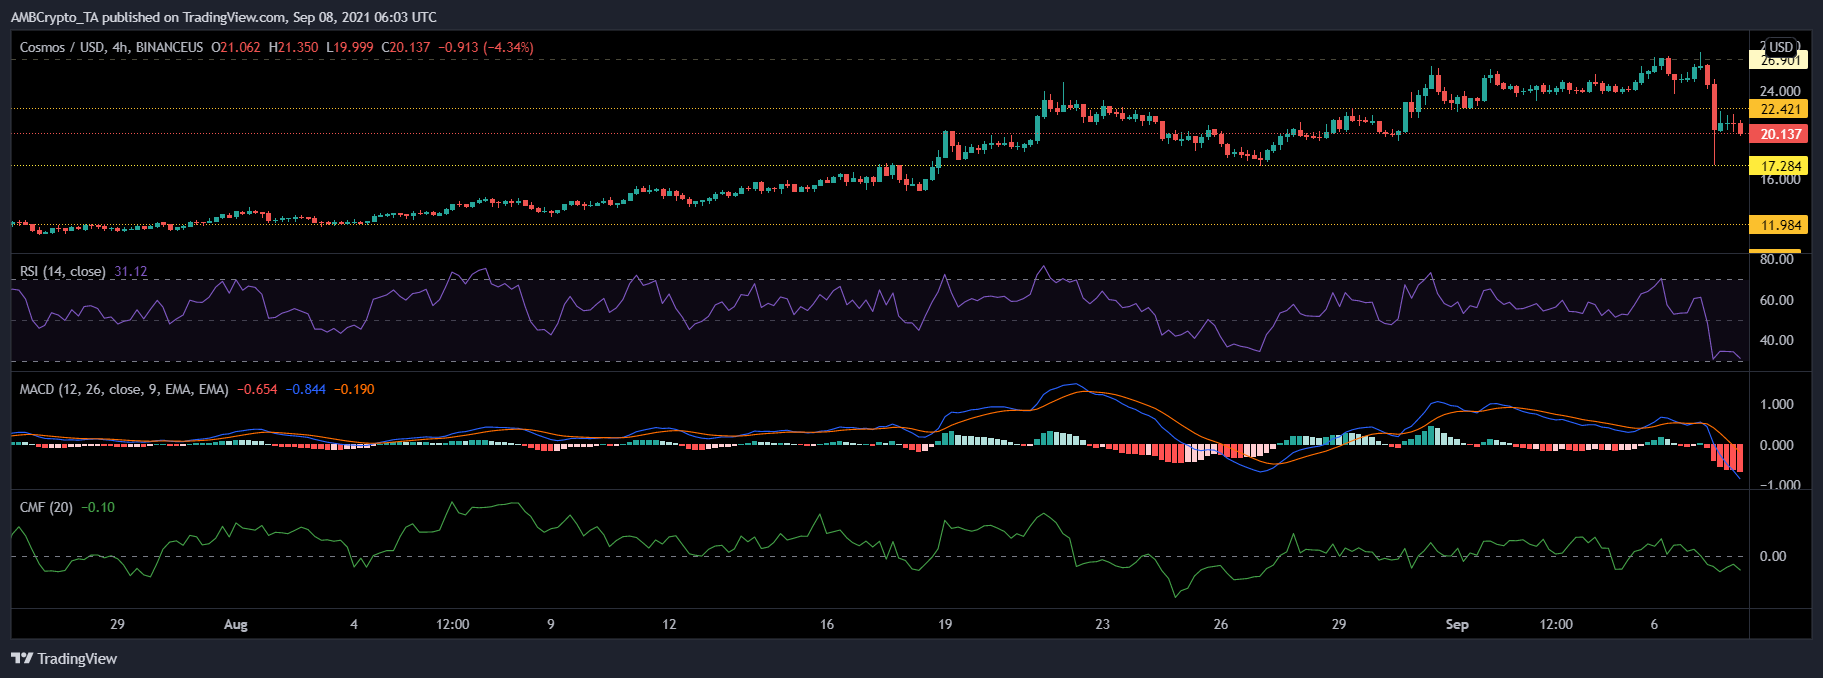
ATOM slumped by a considerable 25.2% and was priced at $20.13. It reversed the gains it made over a week as it stood at its one-week low price point. Further decline, could cause it to sit near the $17.28, a price level it last touched three weeks ago.
Not being able to maintain prices over $17.28 would push ATOM to its monthly low of $11.98. Relative Strength Index hit a multi-month low as the coin threatened to move into the oversold zone. MACD noted red bars on the histogram.
Capital inflows also declined as the Chaikin Money Flow was seen below the half-line. A price reversal could propel ATOM to revisit its $22.42 resistance mark and then reattempt to trade near its multi-month high of $26.90.