NEAR: Amid a minor recovery, here’s where bears can play spoilsport

Disclaimer: The findings of the following analysis are the sole opinions of the writer and should not be considered investment advice.
After dropping towards its two-month baseline at the $9.77-level, NEAR bulls forced an upswing that the sellers finally negated near its ATH resistance zone in the $19-$20 range. Since then, the price has slumped all the way back to its long-term baseline.
Should the current sentiment push the bears to find a close below the $10.9-level, NEAR Could see a short-term setback towards the $9-$10 range before recouping its buying vigor. At press time, NEAR was trading at $10.777, up by 2.74% in the last 24 hours.
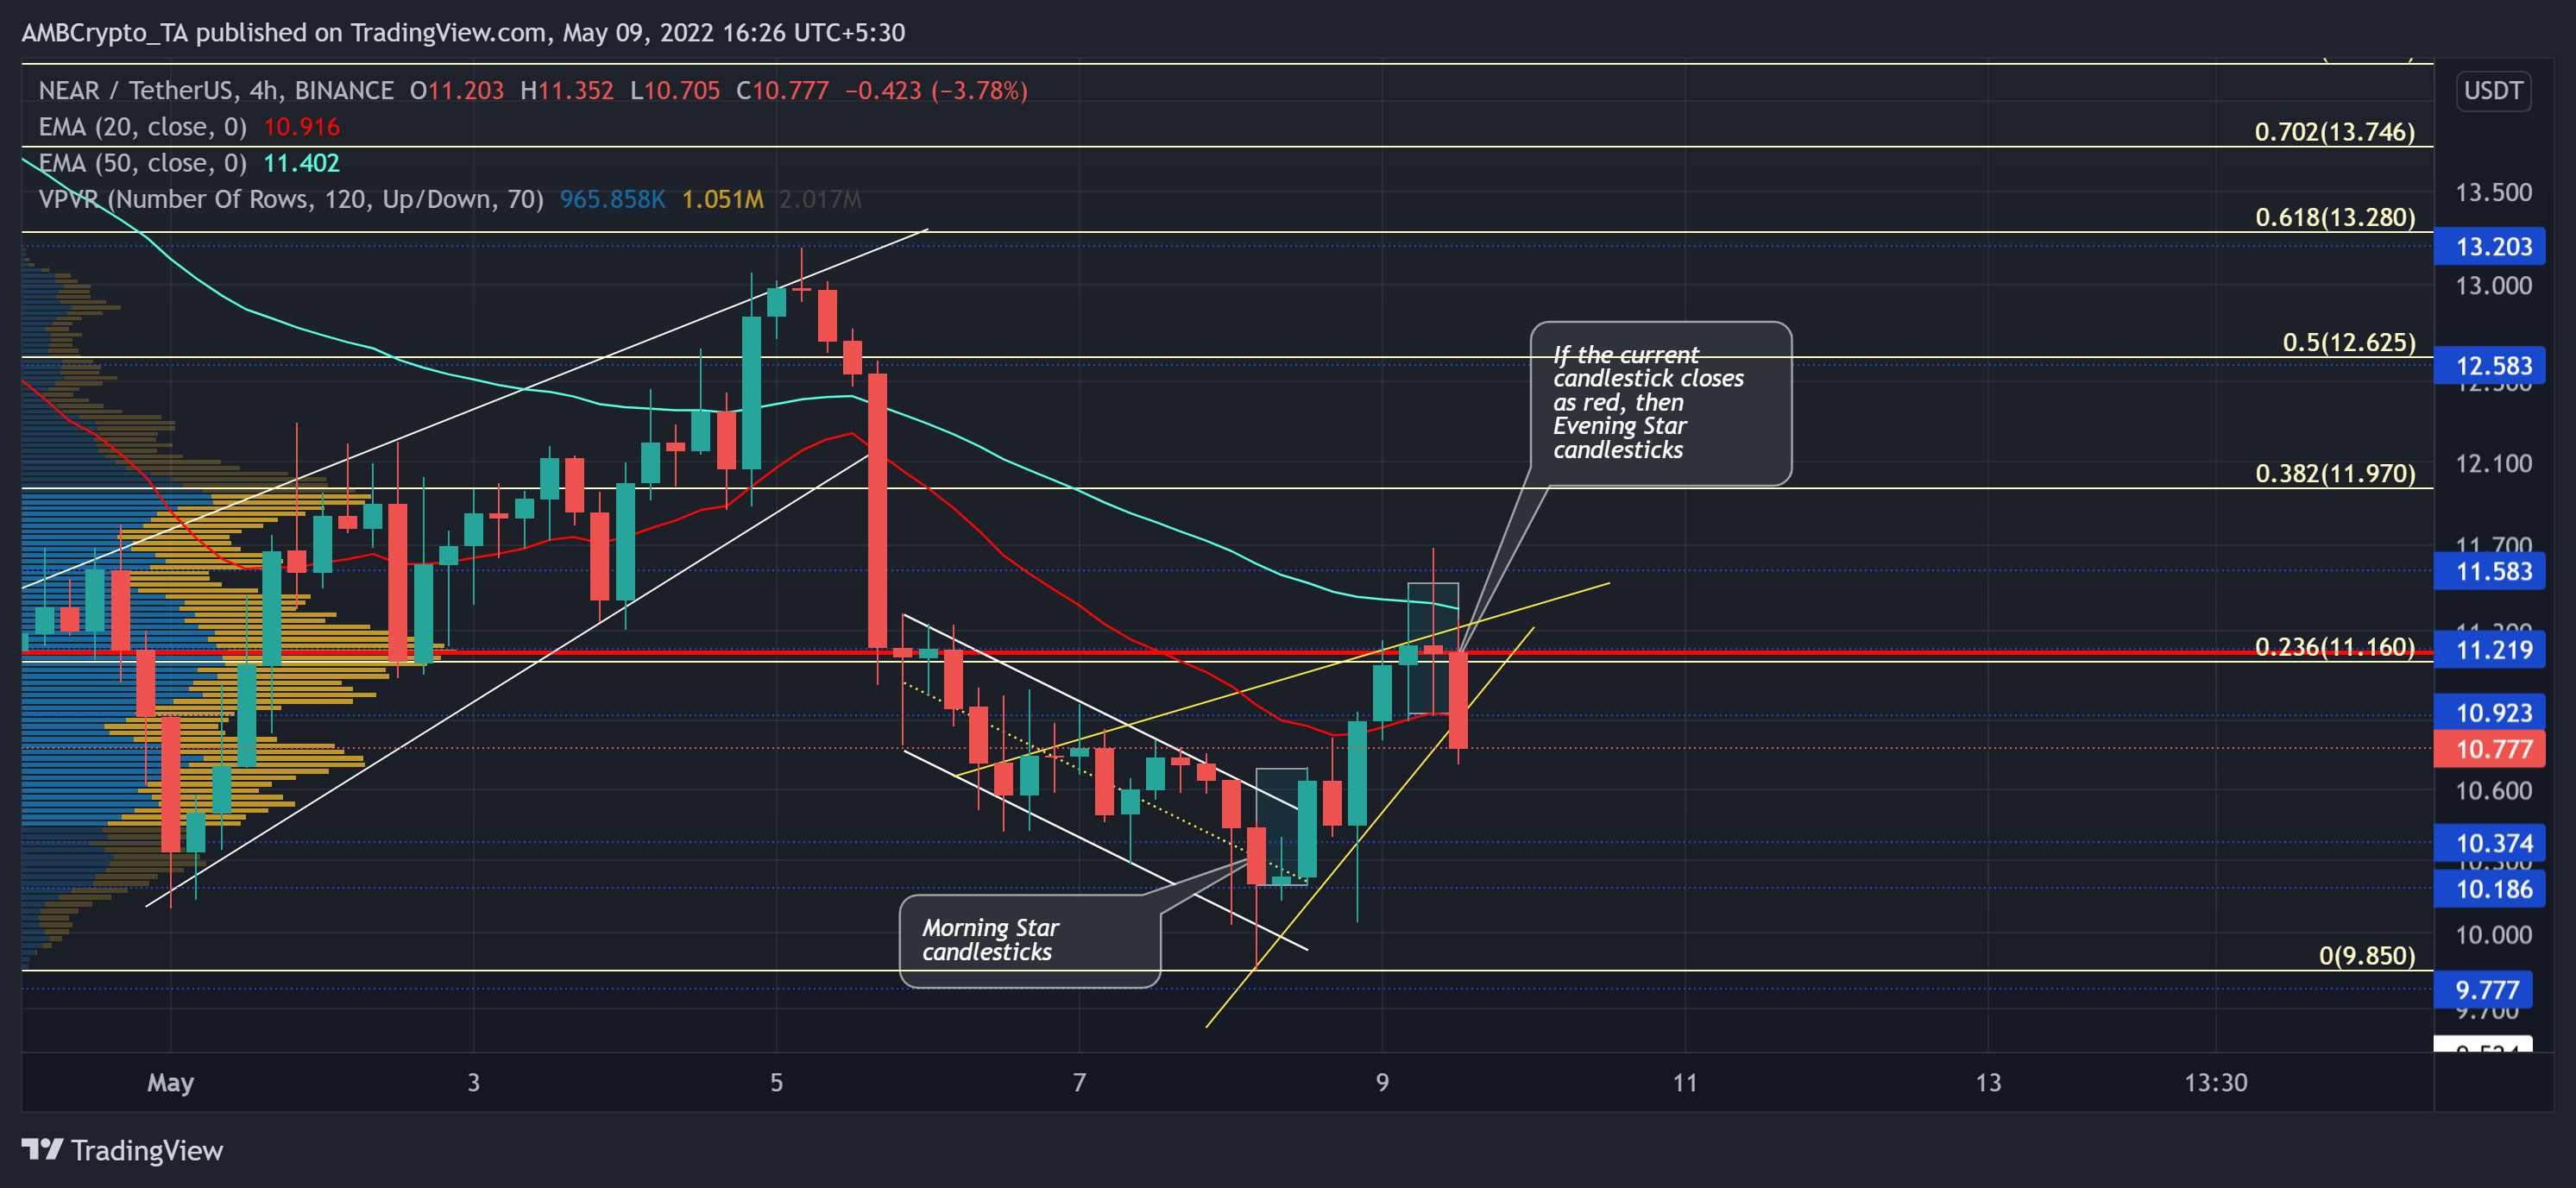
NEAR 4-hour Chart
As the ongoing narrative for NEAR visibly skewed in favor of bears, the sellers have kept regular checks on the peaks and troughs whilst initiating major sell-offs in the last few weeks.
As a result, NEAR lost nearly 50.41% of its value from its multi-week April highs. The recent reversal from the 61.8% Fibonacci resistance added fuel to the alt’s bearish fire as the price action struggled to break the shackles of its 20 EMA (red) and 50 EMA (cyan). Consequently, NEAR plunged below its Point of Control (POC, red) and matched its March lows on 8 May.
Now, as the bulls have shown intentions to defend the $9.77-level for over two months, NEAR contradicted broader market tendencies. Unlike its peer alts, it saw a down-channel breakout after forming a morning star candlestick setup. With the current resistance at the 23.6% level and the POC, a compelling close below the 20 EMA could lead to a short-term setback.
Rationale

The RSI turned its back on the 54-resistance and fell below the mid-line. Thus, it visibly depicted the increasing selling edge over the last few sessions.
But with the CMF holding on its grounds above the zero-mark revealed a rather contrasting position. Should the bulls ensure this mark, the fall on the charts could be short-lived by the $10-support.
Conclusion
Keeping in mind the potential formation of the Evening star candlestick pattern coupled with the RSI losing its mid-line support, the bears could pull the prices down in the $9-$10 zone. Post this, the bulls could aim to recoup their power and challenge the bonds of its POC in the coming times.
Finally, the investors/traders must keep a close on Bitcoin’s movement affecting the market structure to make a profitable move.