Polkadot, Monero, Cosmos Price Analysis: 03 July

Despite inconsistent hikes in the wider market, DOT tested its immediate support levels a couple of times over the last few days, a finding which suggested that it might finally breach it soon. XMR registered lateral movement with a 19.28% fall in trading volume over the last 24 hours. Finally, ATOM gave off an overbought signal on the chart with a 12.55% hike in market capitalization.
Polkadot [DOT]
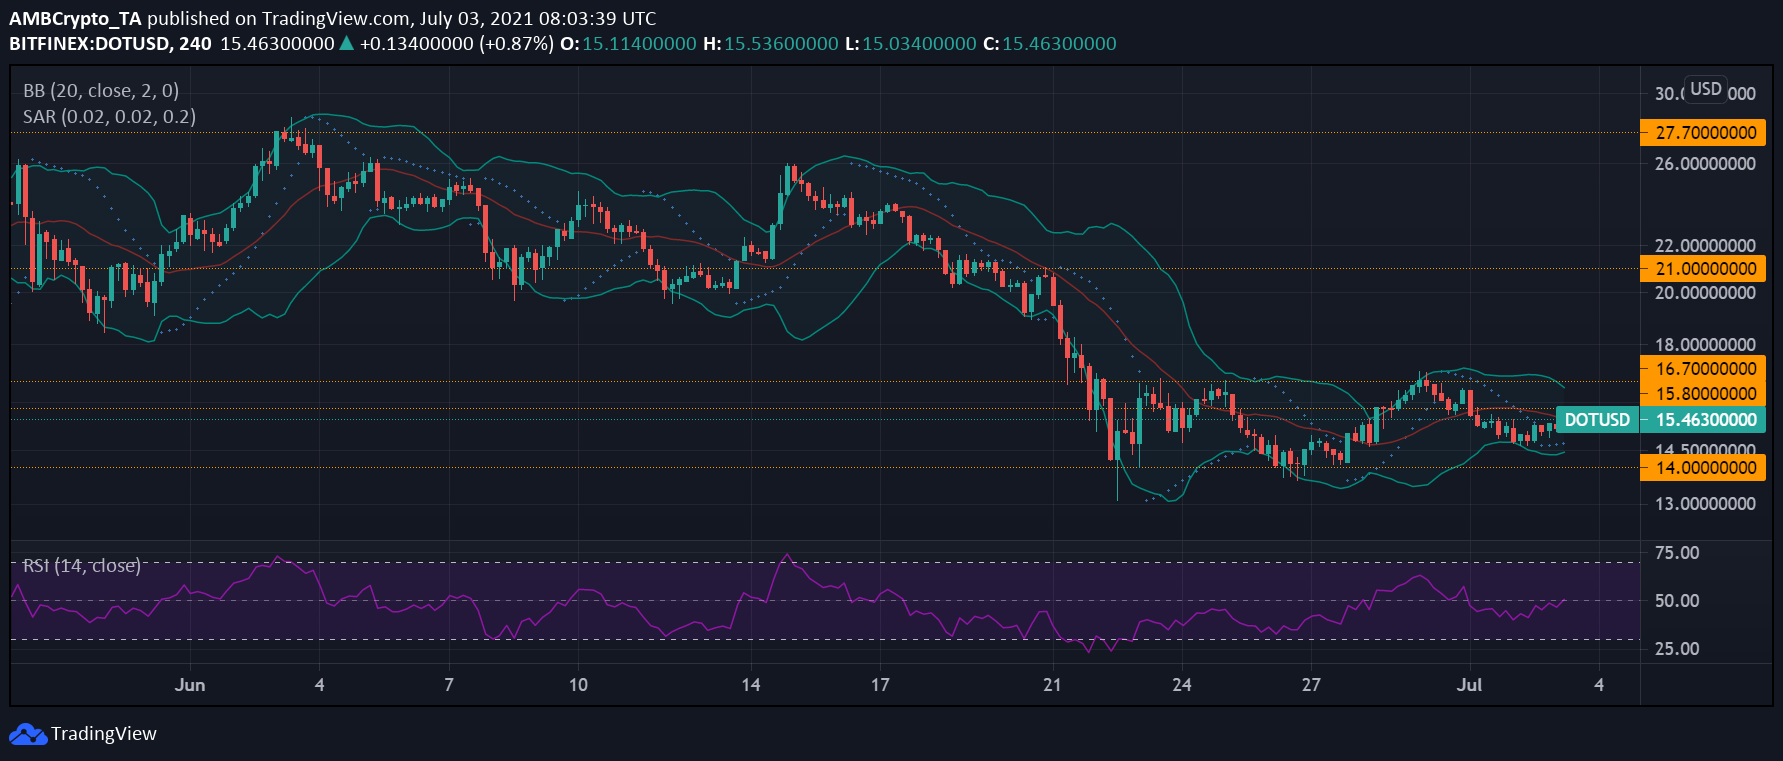
DOT was among the cryptos that did not recover significantly from the June crash. At press time, the altcoin was yet to recover all its losses and was priced at $15.47 on the back of a 3.7% hike in 24 hours.
The altcoin tested the support level of $14 a few times previously and given its price level at press time, if the coin goes on a downtrend again, it may find itself touching the $14 support level soon.
Buying strength picked up over the last 24 hours as the Relative Strength Index noted a small uptick, at the time of writing. This meant that selling pressure declined a little too. The Parabolic SAR concurred with the hike in price, with the dotted lines found below the candlesticks.
In terms of volatility, the Bollinger Bands registered a slight convergence, one suggesting that the crypto may see reduced price volatility over the next few trading sessions.
Monero [XMR]
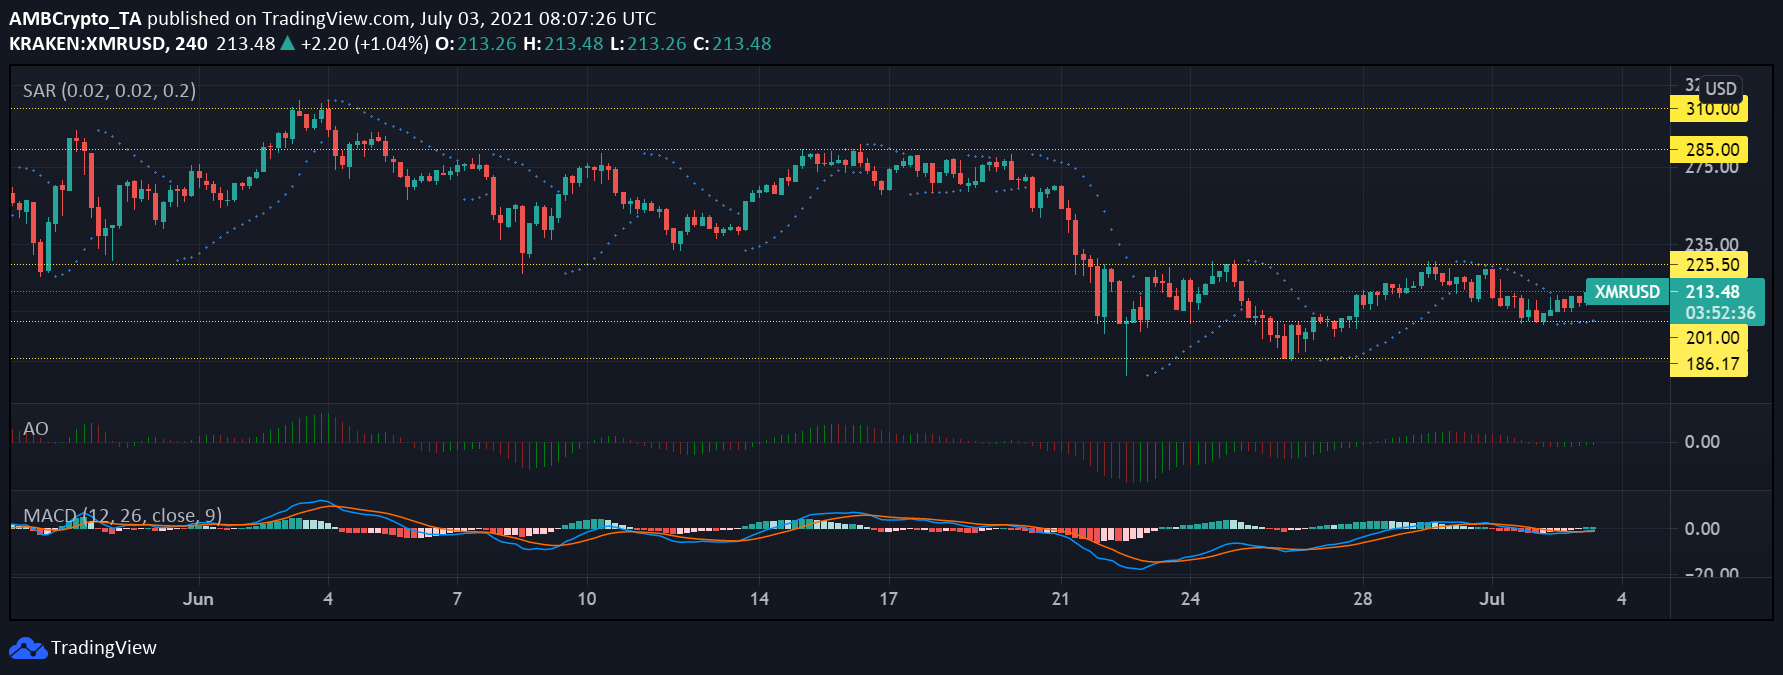
Monero‘s price movement was also directionless as the crypto was seen consolidating between the support level of $200 and resistance level of $225. At press time, the alt was trading at $213. With daily gains of 4.6% and weekly gains of 8.2 % Monero, despite some recent price hikes, was at the end of a downtrend from its price levels before 21 June.
On the Awesome Oscillator, the alt marked the onset of bullish momentum as green lines were spotted below the indicator. In case of a further surge in the price, the next resistance level to watch out for would be $225. The Parabolic SAR highlighted an uptrend for XMR, with the crypto experiencing slight gains over the last 24 hours.
The MACD lines were meeting after a bearish crossover, while the histogram projected a bullish signal with green bars visible on the indicator.
Cosmos [ATOM]
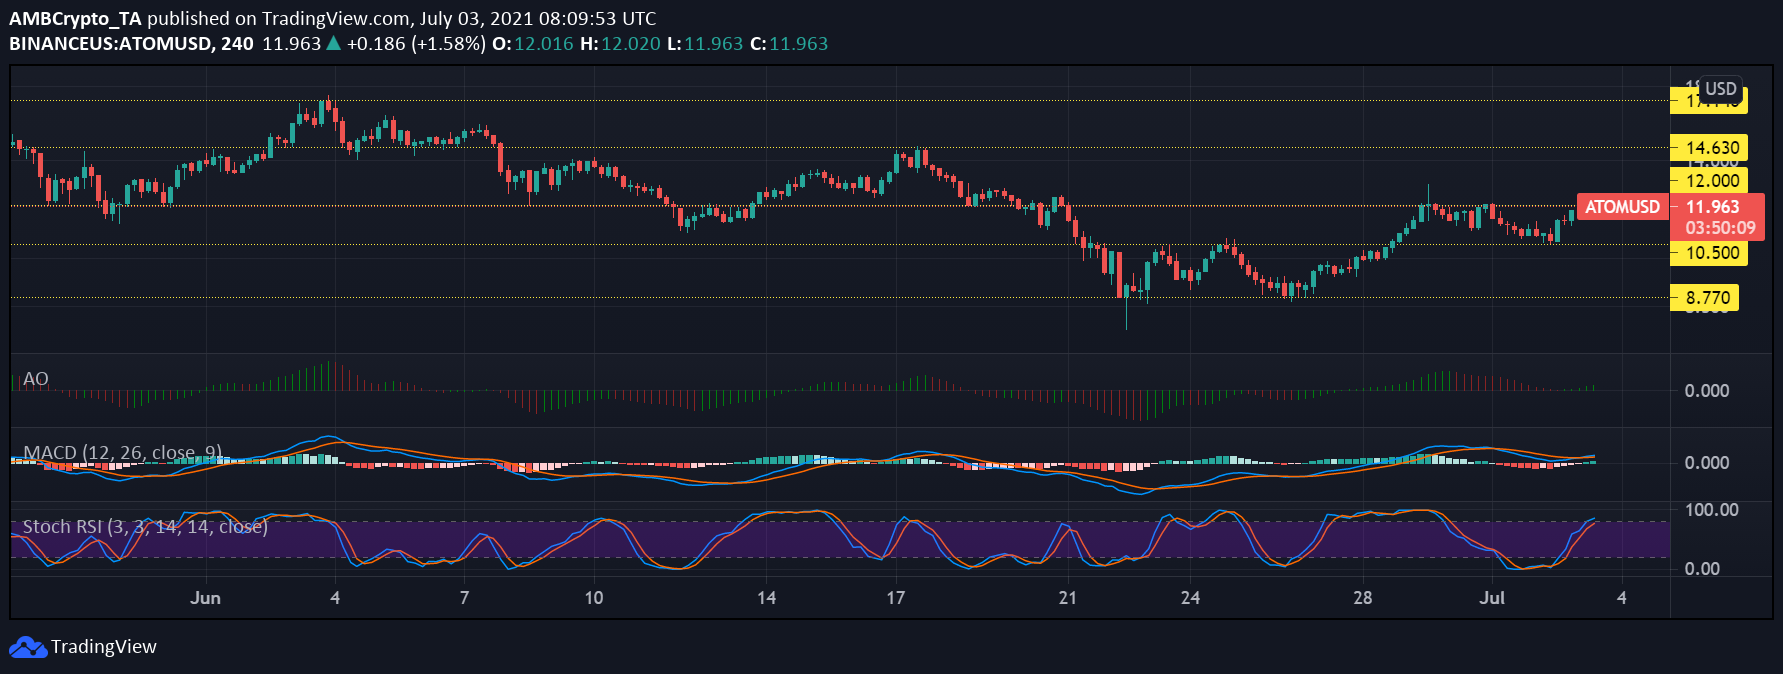
ATOM has been on an uptrend since 26 June. However, it started to consolidate between its immediate support and resistance levels a couple of days back. ATOM’s price rose by 22.8% over the past week and at press time, it was trading in the green. If the price does not fall any further, the alt will likely test the resistance at $14.60.
ATOM’s technical indicators hinted at short-term bullish momentum over the next few days as it tried to breach the $14.60 resistance level. Meanwhile, if the price falls, the support region for the crypto-asset could be $8.70.
The Awesome Oscillator spelled out bullish sentiment as the green bars were spotted above the zero-mark. On 3 July, there was a bullish crossover, as demonstrated on the MACD indicator.
The Stochastic RSI signaled that ATOM was heading towards the overbought zone.