Polkadot, Solana and Algorand Price Analysis: June 14

The global crypto market cap was $1.72 Trillion and there was a 2.6% increase in the last 24 hours. Elon Musk’s recent tweet about how Tesla would resume accepting Bitcoin transactions provided mining is done with renewable energy had an effect on Bitcoin’s price as the asset shot up by 12% in the past 24 hours. Other Altcoins have also been impacted positively owing to the increase in Bitcoin’s price.
Polkadot (DOT)
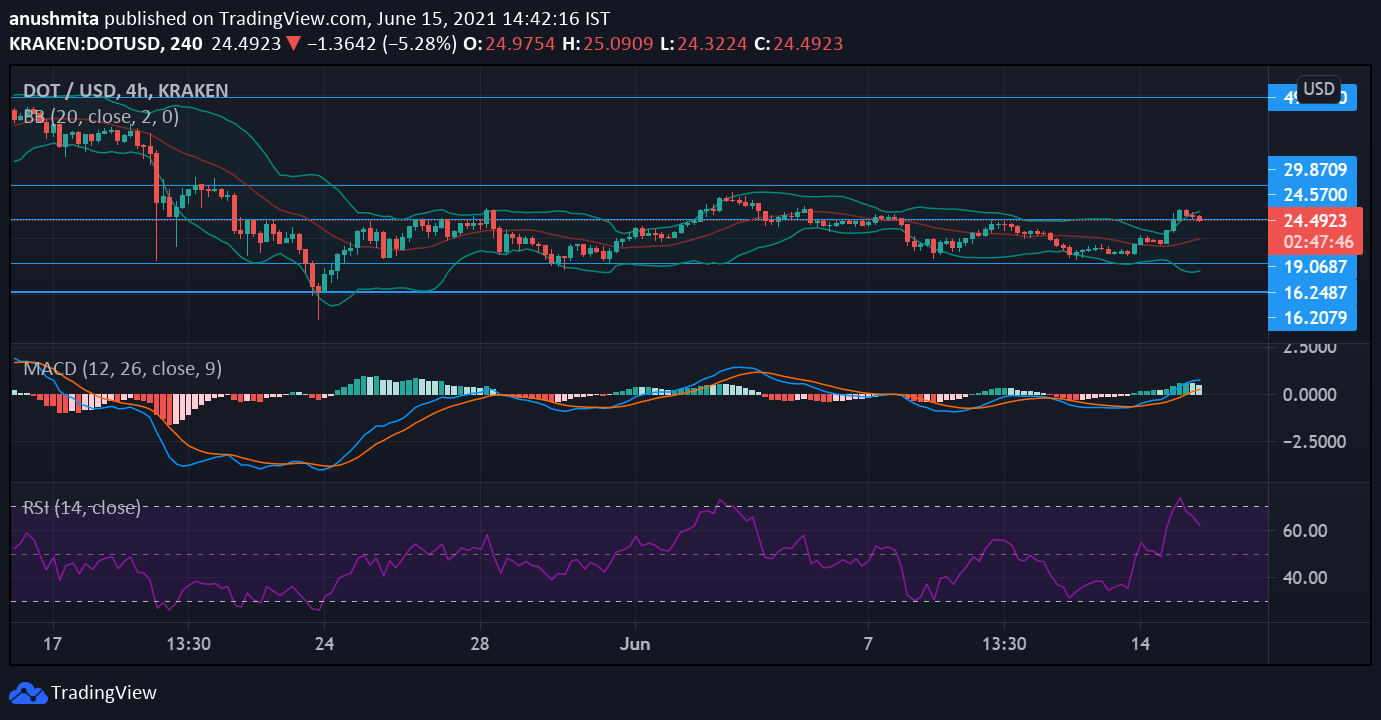
The price of DOT was up by 14% in the last 24 hours after most Altcoins experienced a surge in prices. The coin was priced at $24.50 at the time of writing. DOT’s prices have not fluctuated much after the crypto crash that occurred a week ago, however, there was a surge in prices on June 14.
The coin experienced sideways movement and had oscillated between support at $19 and resistance at $27 resistance since the beginning of June, however, another price surge would mean that DOT breaks the $27 price resistance.
MACD depicted a bullish crossover on June 14. Price volatility for the coin remained low as Bollinger Bands stayed narrow indicating lesser price fluctuations.
Relative Strength Index demonstrated an increased buying pressure as the indicator hovered around the overbought zone.
Solana (SOL)
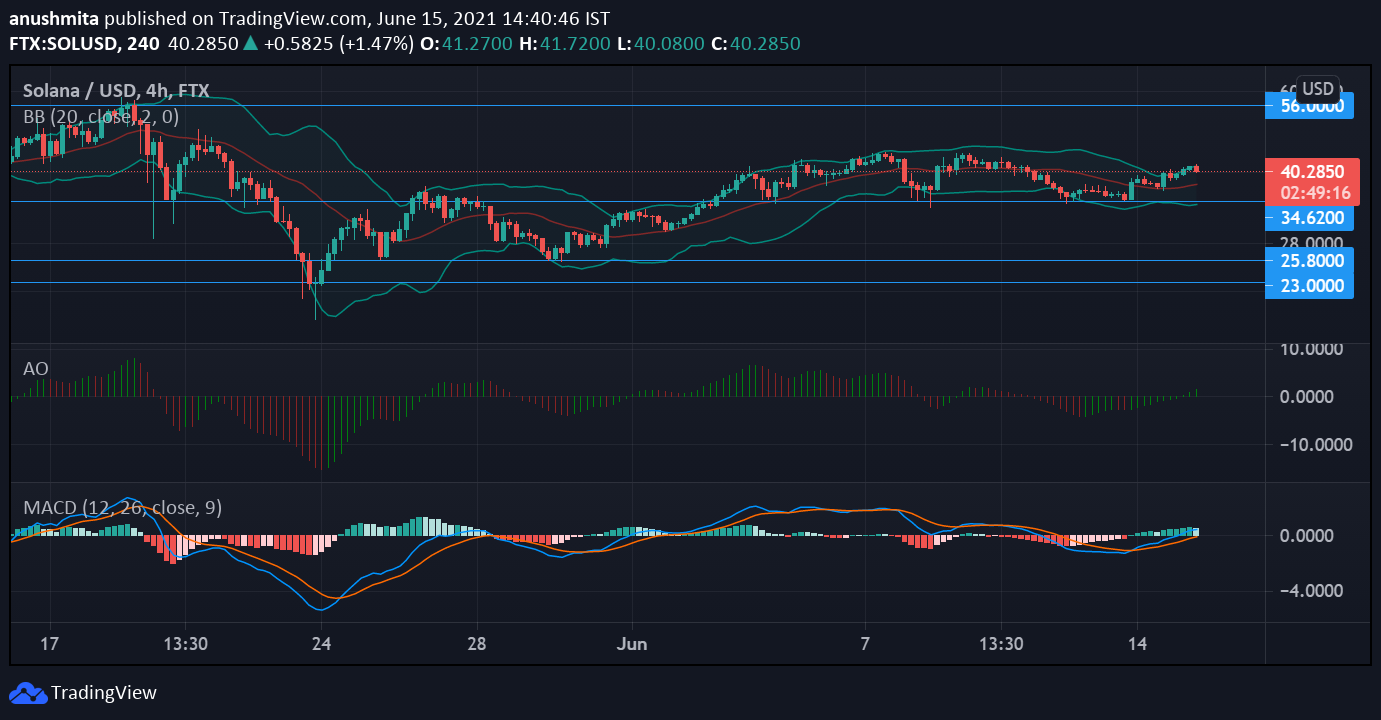
Solana was trading at $41.07 at the time of writing. The coin had faced resistance at the $42 mark for the past week, but with a further increase in prices, it will break through that resistance level in the next couple of hours.
Once the coin breaks past the $42 resistance level, it might experience resistance at $56. Even though the coin was trading in red at press time, the indicators. signaled that it has already embarked on bullish momentum on June 14.
According to Bollinger Bands, prices could go up as the bands look slightly diverged. To support the above argument for a bullish trend, Awesome Oscillator depicted a beginning of a bullish momentum since June 12. MACD histogram also indicated a bullish crossover on June 14.
Algorand (ALGO)
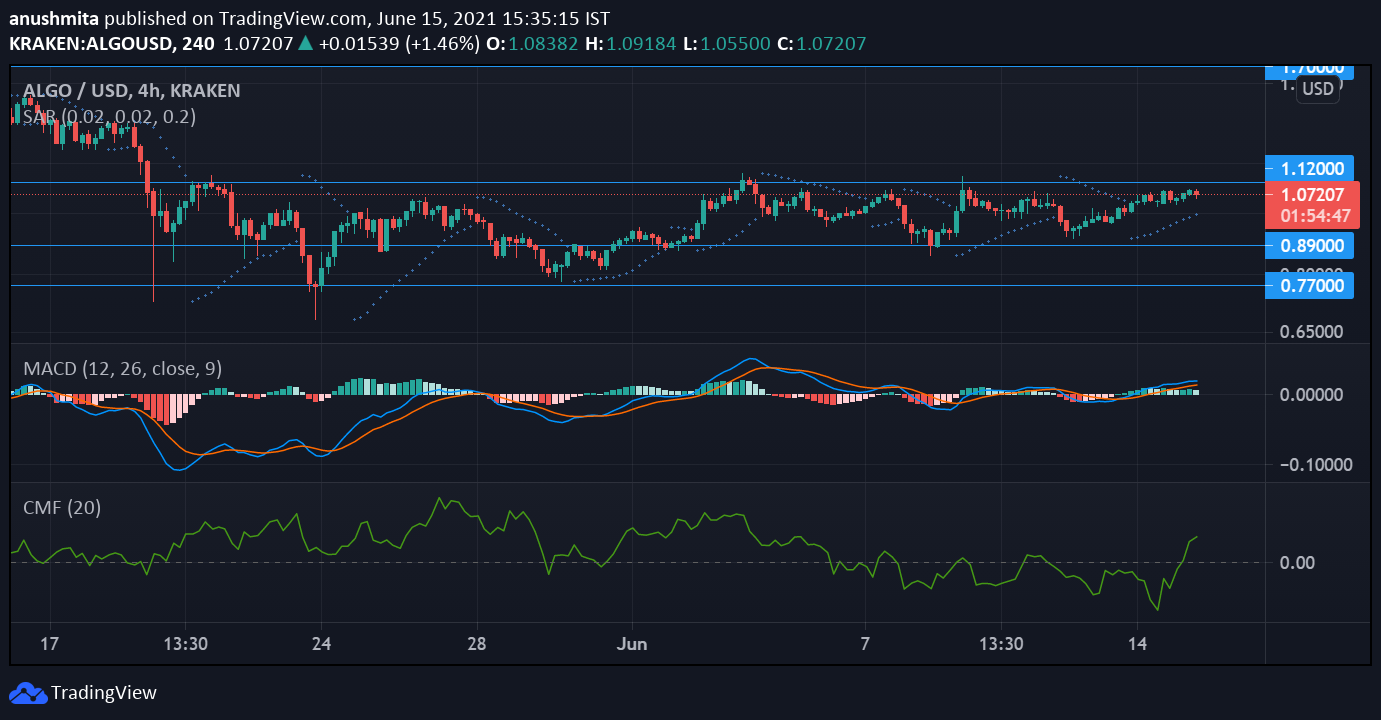
ALGO moved sideways since the beginning of this month; however, after June 13 it had only been on a steady uptrend. ALGO traded above the support level of $0.98 and below the resistance level of $1.24, the price of the coin was $1.07 at the time of writing.
ALGO had breached the $1.12 resistance level a couple of times in the past month, so another hike in the prices would mean that ALGO would go past the $1.12 resistance level. MACD indicator displayed a beginning of a bullish momentum from June 14 which indicated that prices can further shoot up.
Chaikin Money Flow consistently stayed below the half-line indicating that capital outflows were more than inflows, but the indicator went up north on June 15 meaning capital inflows increased in the past 24 hours.


