Polkadot, Tron, VeChain Price Analysis: 11 June

Polkadot was projected to maintain its movement between $19.6 and $25 over the coming days. Tron was in danger of a breakdown towards $0.056 once volatility picked up. Finally, VeChain moved within a down channel and awaited a 28% hike in case of a break above $0.1188.
Polkadot [DOT]
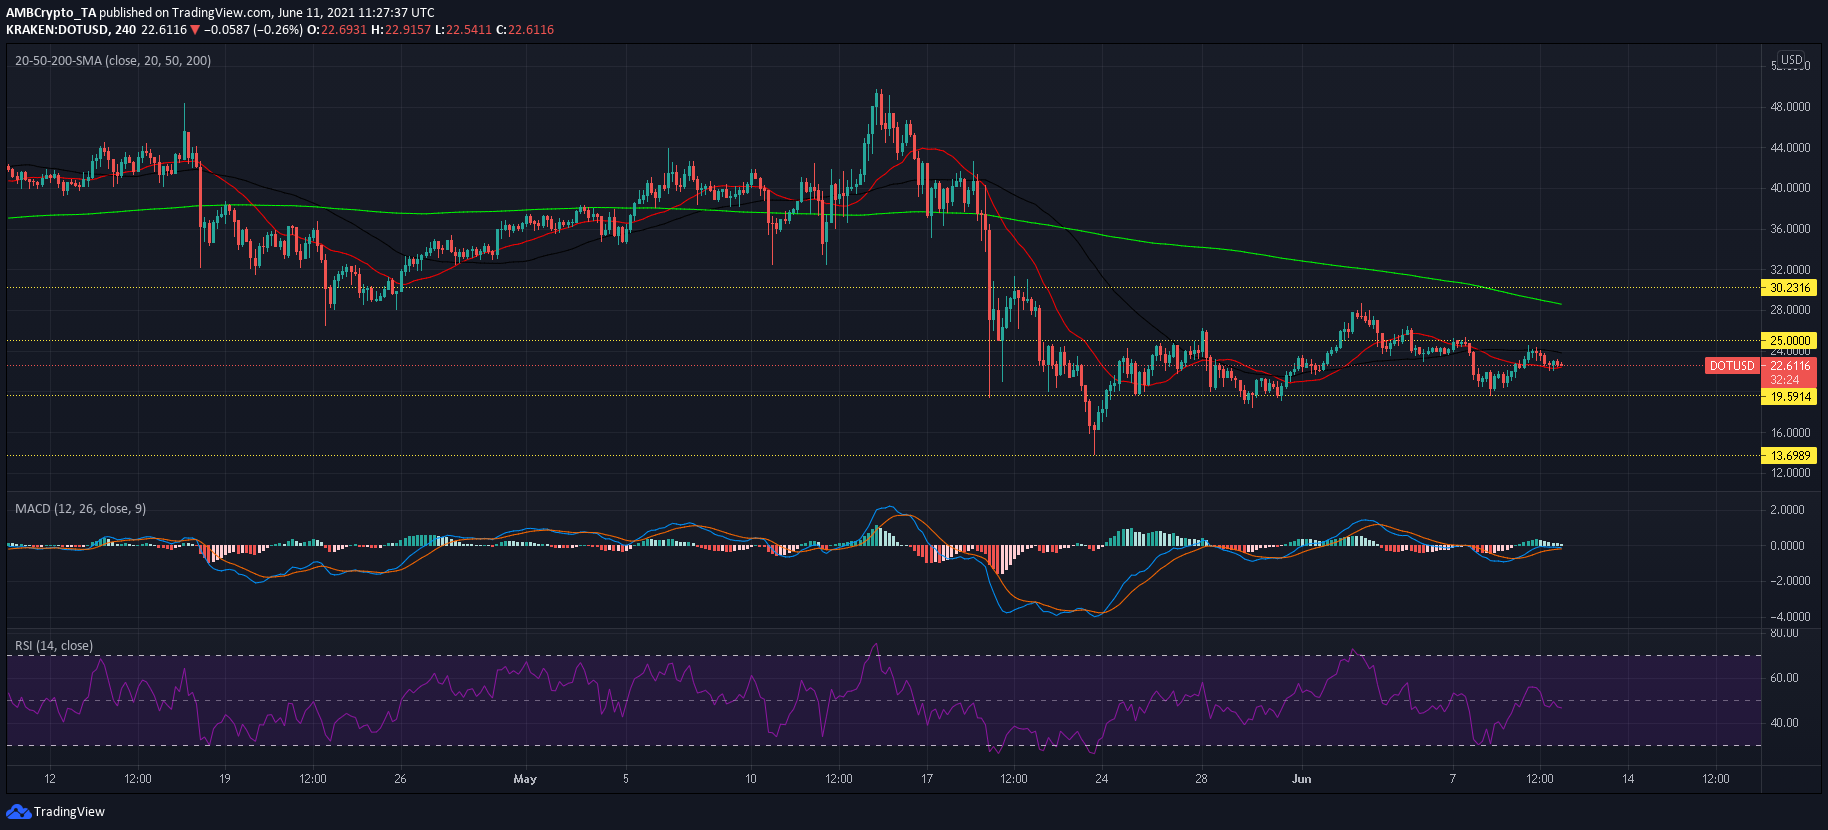
Polkadot’s previous targets were realized once its price broke south of its ascending channel. Losses accumulated up to 17% when calculated from the bottom trendline of a down-channel to the $19.6-support. Once Bitcoin reclaimed the $38,000-mark and buyers returned to the altcoin market, DOT saw an over 20% jump, but its price was capped at the $25-resistance. The last few sessions saw some downwards price action and the bulls were running out of momentum to alleviate incoming losses.
According to the MACD’s histogram, bullish momentum was on a decline as the index closed in on a bearish crossover. The RSI made its second lower high and could move into bearish territory. Nevertheless, DOT was sandwiched between the strong resistance at $25 and the strong support around $19.6 and the price will likely oscillate between this channel in the shorter-term.
Tron [TRX]

Tron’s price saw no significant movement over the past three weeks and kept its channel of $0.0841 and $0.068 intact. The Bollinger Bands remained constricted over this timeframe and highlighted low volatility in the market. However, the RSI’s southbound trajectory presented a few warning signs for the ‘Ethereum Killer’.
A gradual decline towards the oversold territory could see TRX head back to its demand zone at $0.056, especially if volatility picks up. Conversely, a breakout would push TRX north, but further upside could be denied by the 200-SMA (green) and the $0.093-resistance.
VeChain [VET]

Since VeChain formed lower highs and lows over the past week, a down-channel formed on its 4-hour chart. However, VET bulls need to counter some bearish signals before attempting a breakout from the pattern. The first signal came on the back of the RSI’s downtrend. A push towards the oversold region would likely negate the pattern and lead to a breakdown. The second signal was presented by the MACD which was close to a bearish crossover.
In case of a breakout, a hike above the $0.1188-resistance could trigger a 28% jump towards the next ceiling at $0.152.


