Polkadot’s traders must look out for this ‘small window’ of opportunity

Disclaimer: The findings of the following analysis are the sole opinions of the writer and should not be taken as investment advice
Bitcoin’s rebound from $30k in late July seemed to have ignited an altcoin race, the result of which is yet to be determined. As far as the top 20 coins by market cap are concerned, pole position seemed to be held by Polkadot.
Its value soared by nearly 100% after rising from a low of $10.3 to a high of $19.8 over the last two weeks. While this move alone did deserve commemoration, a closer look at DOT’s chart revealed that the digital asset was still within the confines of a down-channel.
At the time of writing, Polkadot was trading at $17.35 and held the ninth position on CoinMarketCap’s rankings.
Polkadot Daily Chart
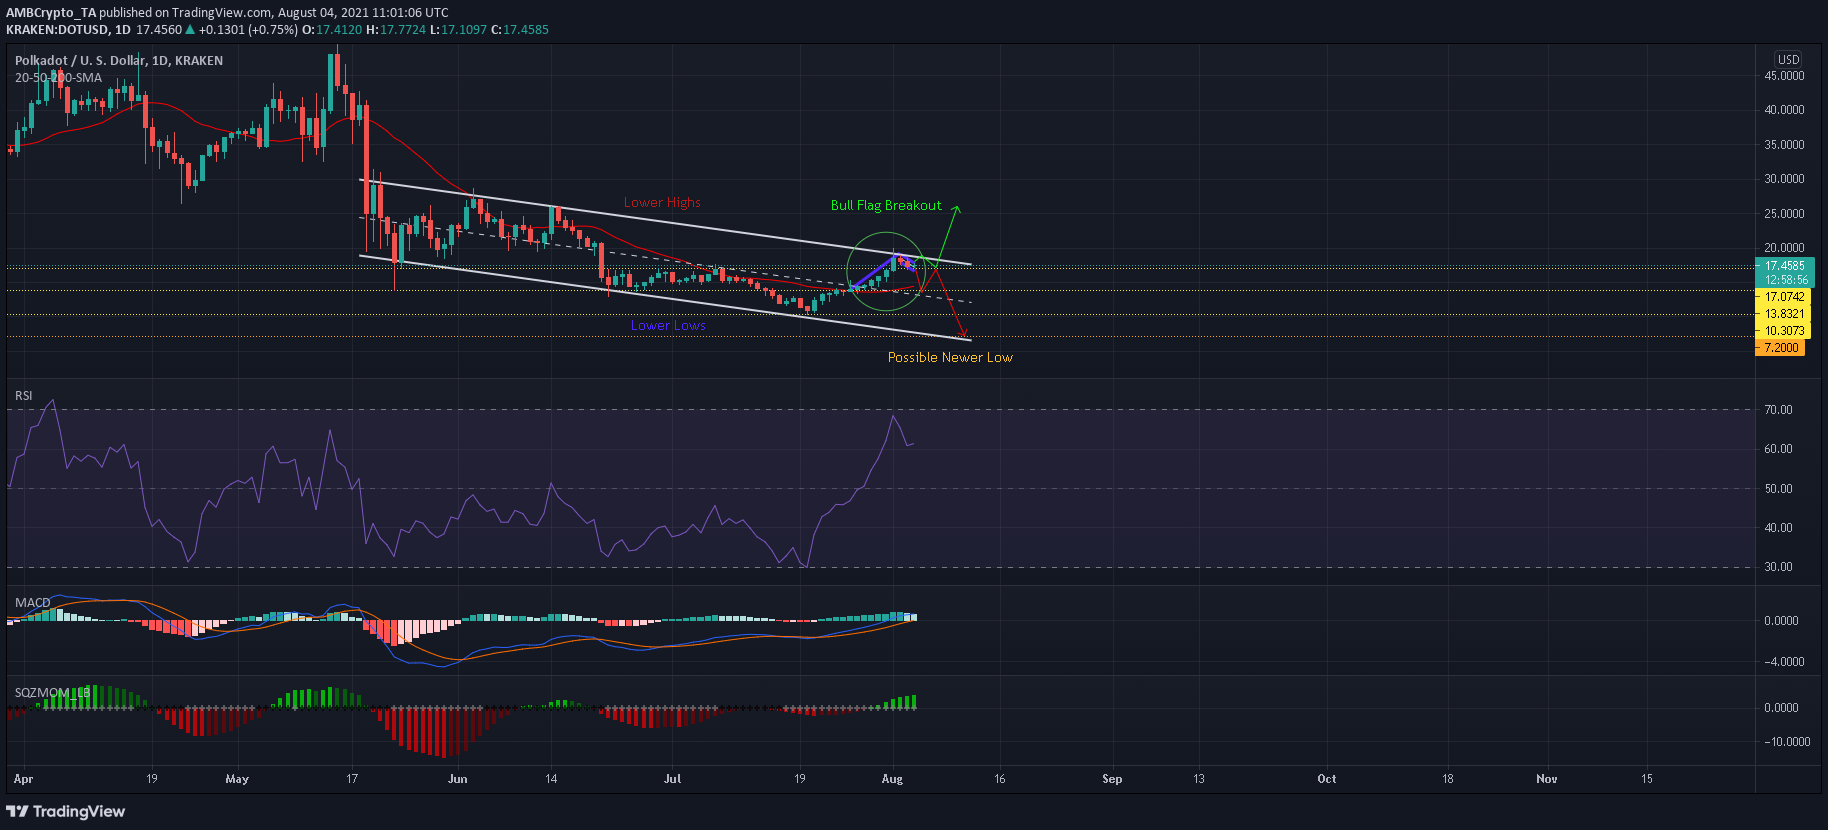
Plotting DOT’s movement since 19 May highlighted an overall downtrend, even when considering its latest rally. Lower lows formed at $13.8, $13, and $10.3 as DOT steadily declined in value. The rebound from $10.3 was an important development, but DOT’s peak at $19.6 did indicate an overall lower high. What this meant was that a downtrend was still active at press time.
Next Destination?
DOT’s support levels rested at $17.07 and $13.8. The latter coincided with the 20-SMA (red) and the half-line of the pattern. A fall below this area would heighten chances of another lower low which can be formed at $7.2 – A level that was last seen in early January. This would result in another catastrophic loss in value.
Potential Breakout?
It’s not like DOT’s recent rally was all for naught. A bull flag was formed and there are chances of an upwards breakout over the coming days. A rise above the upper trendline of DOT’s down-channel would mean a potential trend switch in favor of the buyers. The indicators also maintained their bullish position.
The RSI traded above 60, the MACD resumed its northbound movement, and the Squeeze Momentum Indicator noted the presence of upwards pressure in the market. However, if the bulls do come out on top, an immediate reversal would be required.
Conclusion
Polkadot’s down-channel projected a bearish path over the course of the coming weeks. A close below the half-line of the pattern would validate a move towards the lower trendline and a newer low. However, bulls do have a small window to tilt the tide in their favor.
A bounceback from $17.07 would present chances of an upwards breakout from a bull flag pattern.