Polkadot’s weak bullish narrative needs this much-needed respite

Disclaimer: The findings of the following analysis are the sole opinions of the writer and should not be taken as investment advice
Bitcoin’s latest sell-off from the $48k-mark had a domino effect on the altcoin market. Major alts among the top 10 declined by 2.17% – 6.66% amid panic selling. For Polkadot, losses were on the extreme end of the aforementioned range. A correction phase was already active in the market at that time, something that may have accentuated DOT’s fall on the charts.
On the plus side, DOT’s lower trendline was yet to be disturbed at press time. This meant that DOT was well within an uptrend. If the price does find support anywhere above its 38.2% Fibonacci level, a quick recovery can be expected.
At the time of writing, DOT was trading at $29.1, down by 6.6% over the last 24 hours.
Polkadot 4-hour Chart
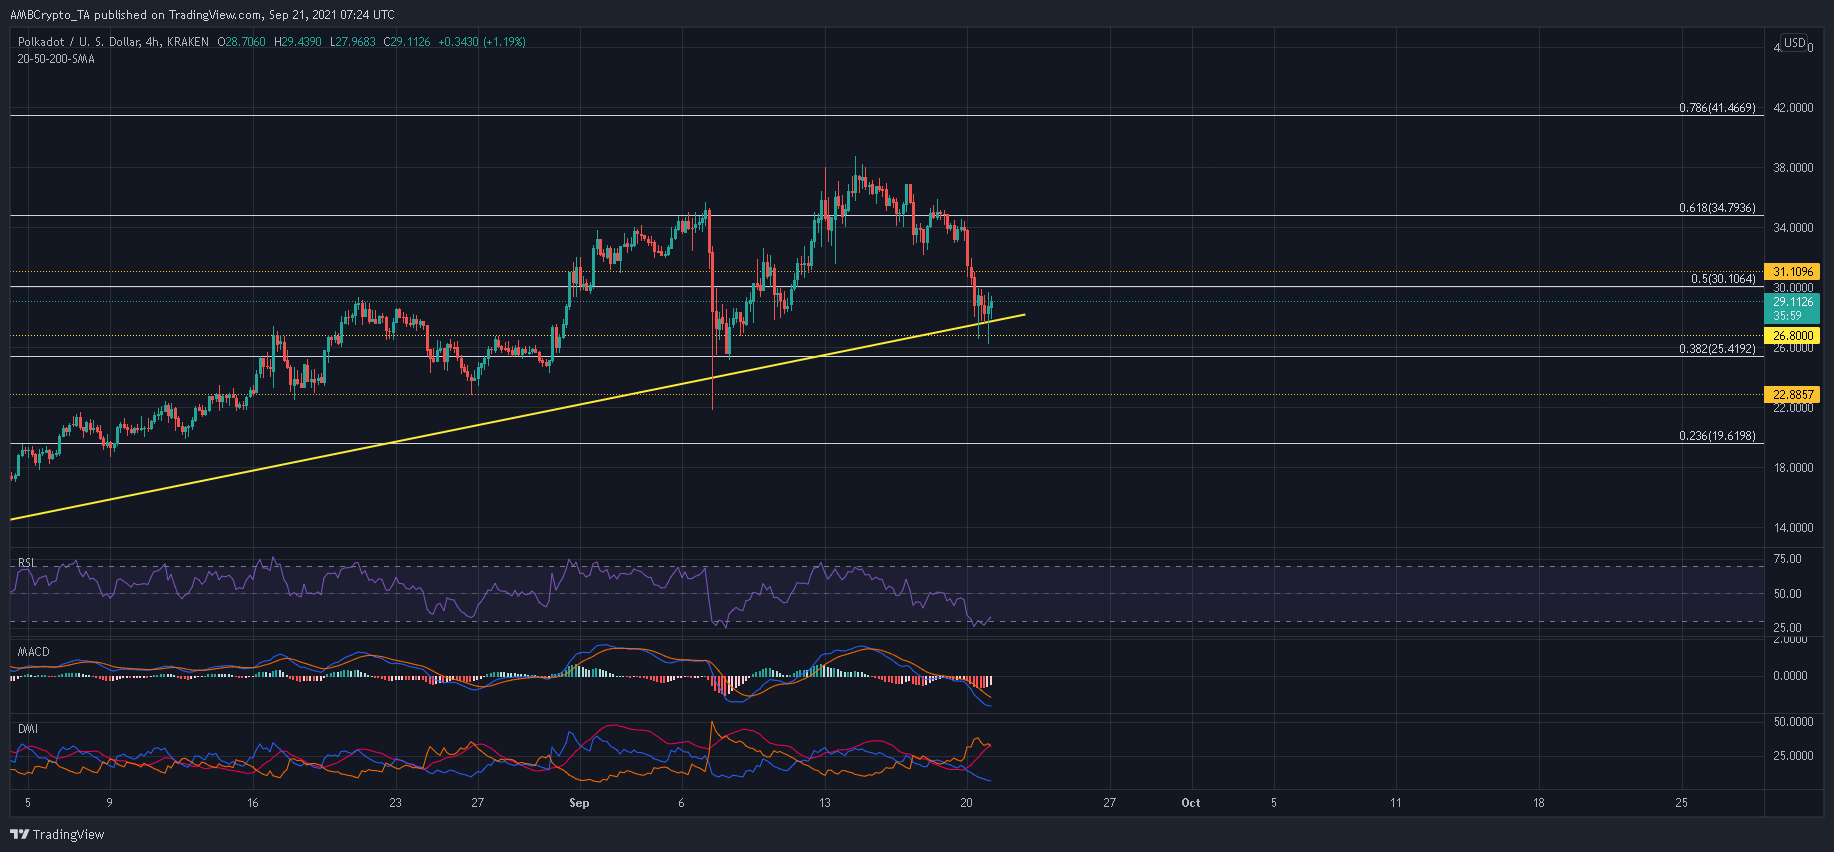
Since late July, Polkadot has formed consistent higher highs and higher lows. This was chalked out by a lower ascending trendline which extended all the way from the $10.5-mark. Even after 7 September’s decline, DOT was able to maintain its bullish trajectory after bouncing back from its 38.2% Fibonacci level. In fact, this marked another higher low.
Now, if this cycle is maintained and DOT is able to find a higher level of support, an uptrend would very much still be active in the market. That would also identify DOT’s next leg upwards. A closer look at DOT’s 4-hour chart suggested that buyers are already responding to this outlook.
A couple of green candles appeared after DOT touched the $28.6-support. From here, a close above the 50% Fibonacci level and $31.1 would keep DOT’s trend intact and push the alt to a fresher local high above $38.8.
On the other hand, a close below the 38.2% Fibonacci level would mark a lower low and threaten to overturn DOT’s bullish predictions. Losses may extend all the way to $22.8 if short-sellers jump on board as well.
Reasoning
According to the RSI’s reading, a price reversal seemed to be in order. The RSI’s movement into oversold territory usually triggers buying behavior as investors rush in to grab the asset at a discounted level.
A slight recovery was also observed on the MACD after it fell to a near 3-month low. However, the Directional Movement Index’s trajectory suggested that sellers were still dominant. The -DI line gained some distance on the +DI line and a rising ADX meant that DOT remained vulnerable to additional losses.
Conclusion
Based on the aforementioned factors, it is too early to call for a bullish comeback even though a couple of weak green candlesticks formed on DOT’s chart.
To confirm a favorable outlook, DOT needs to close above $31 and its 61.8% Fibonacci level. If not, the market would be at the risk of a lower low and a possible shift in trends.