Polygon [MATIC] traders can chalk out a breakout strategy from this pattern

Disclaimer: The findings of the following analysis are the sole opinions of the writer and should not be considered investment advice.
In gearing up its recovery efforts, Polygon’s [MATIC] latest bull run propelled a bullish flip on the 4-hour EMA ribbons. However, the $0.87-$0.88 range induced a selling resurgence to cause a compression near the brink of the ribbons.
A prolonged close below the up-channel (yellow) would confirm a breakdown and hint at an increasing selling vigor. A reliable rebound from the 20 EMA must occur to prevent the near-term bearish inclinations. At press time, MATIC was trading at $0.8787.
MATIC 4-hour Chart
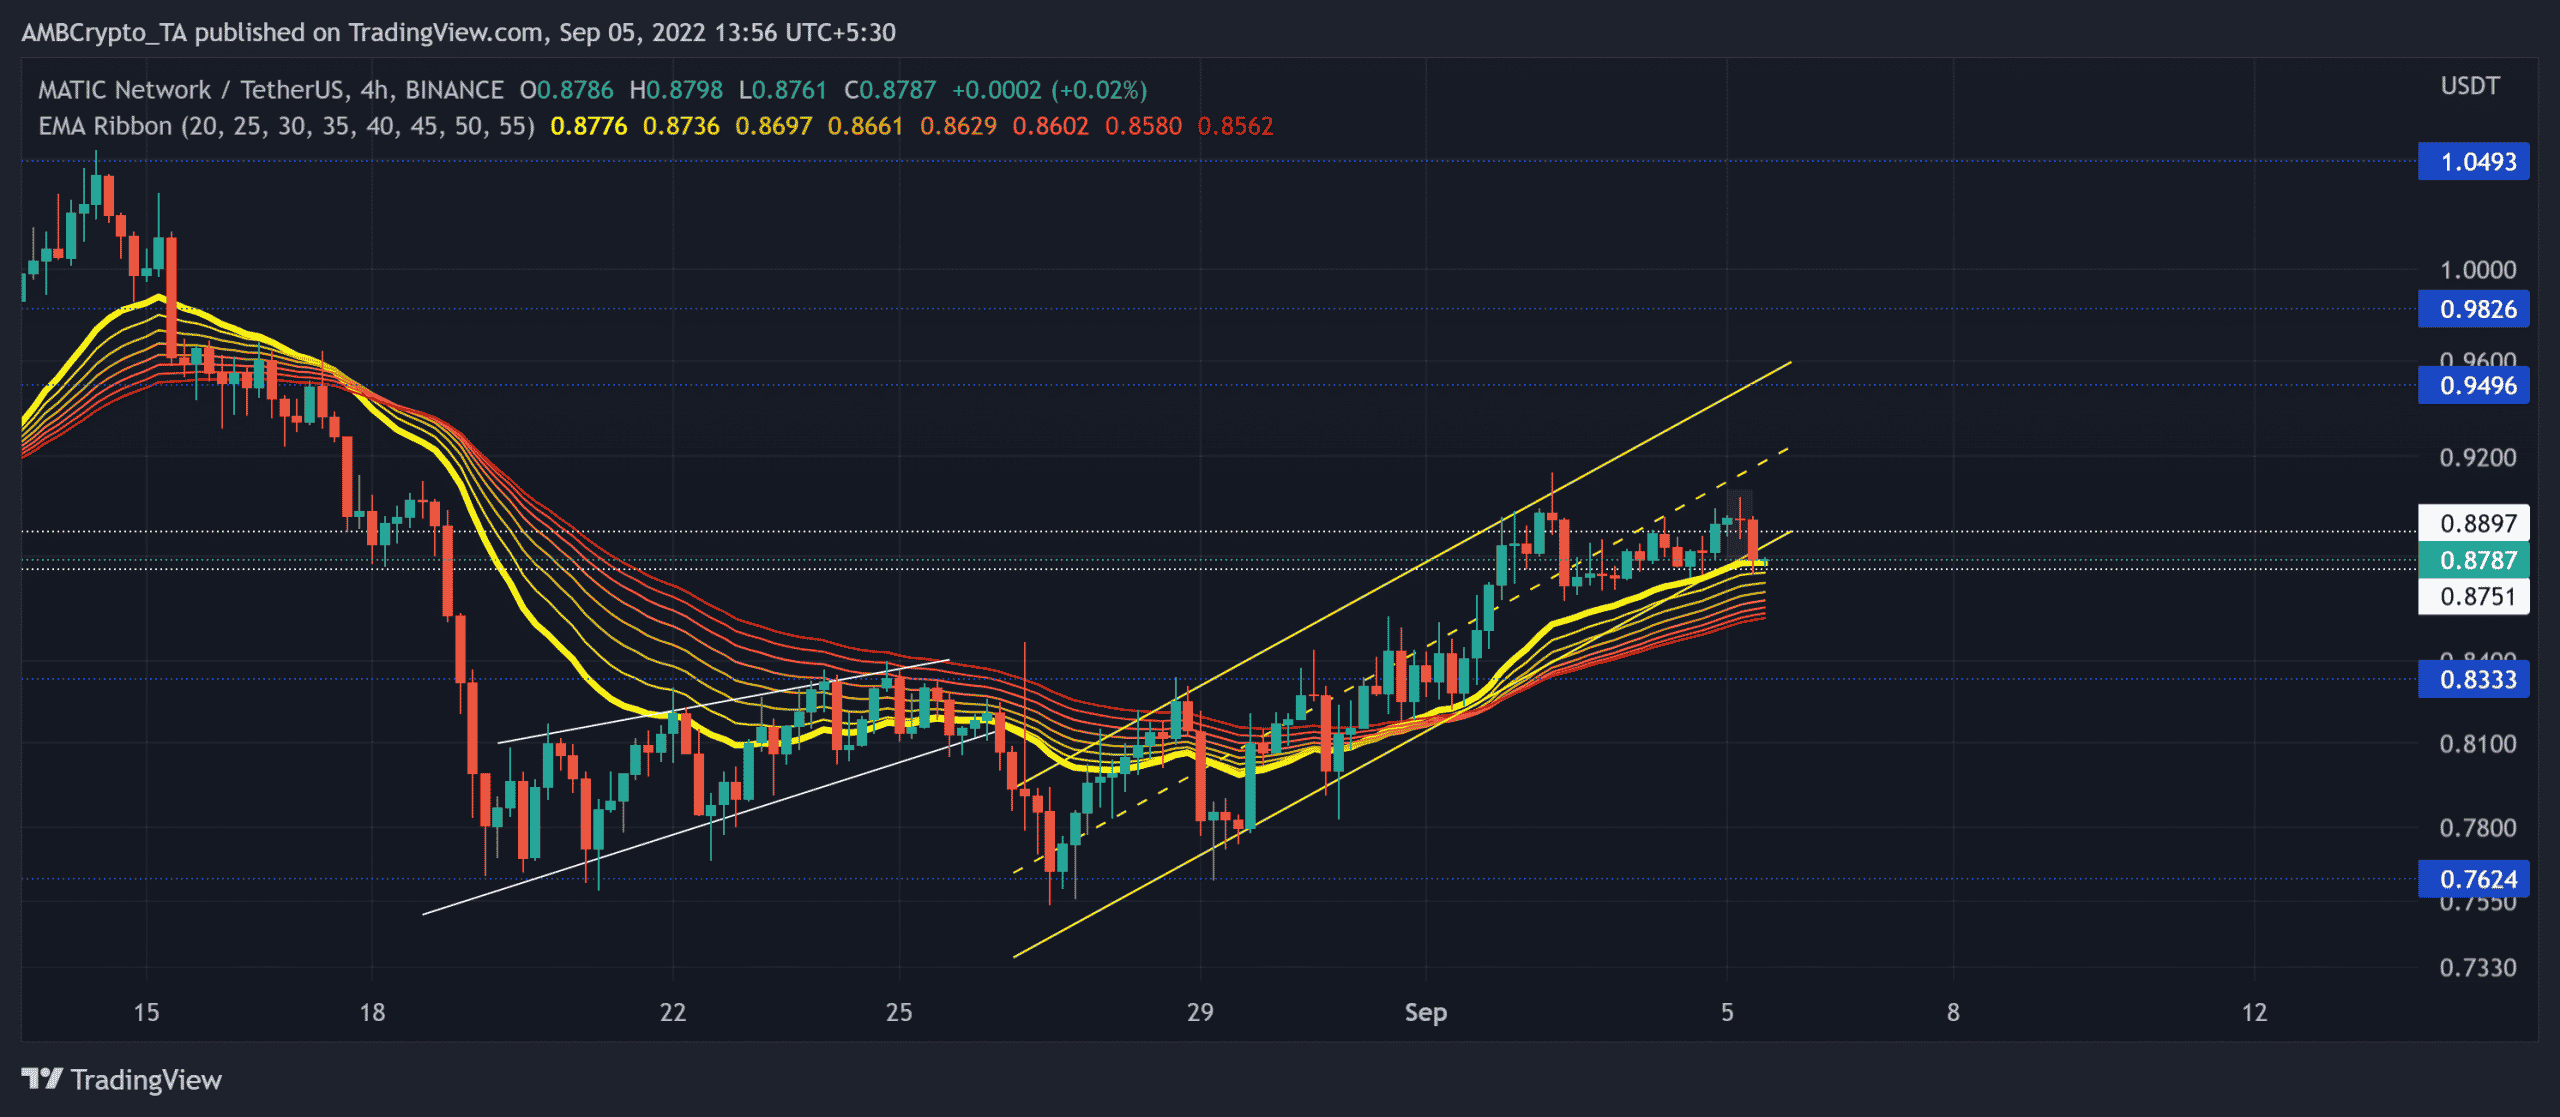
After an expected breakdown from its previous bearish pennant, MATIC showed strong rebounding tendencies from the $0.76 baseline.
The recent ascending channel revival aided MATIC bulls in testing the crucial $0.88-$0.87 resistance range. Also, the press time market sentiment alongside this resistance range created a relatively conducive environment for the bears.
Furthermore, the last three candlesticks have taken a bearish stance by forming an evening star pattern. A likely streak of red candles could further reignite the selling edge.
A robust close below the $0.87-level could brace MATIC for a near-term downside. The sellers would look to test the $0.83-$0.84 range before a likely revival.
However, A sway above the 20 EMA could ensure a sluggish phase in the current resistance range. But the bulls were yet to trigger a spike in the trading volumes to sustain a close above the immediate resistance range.
Rationale
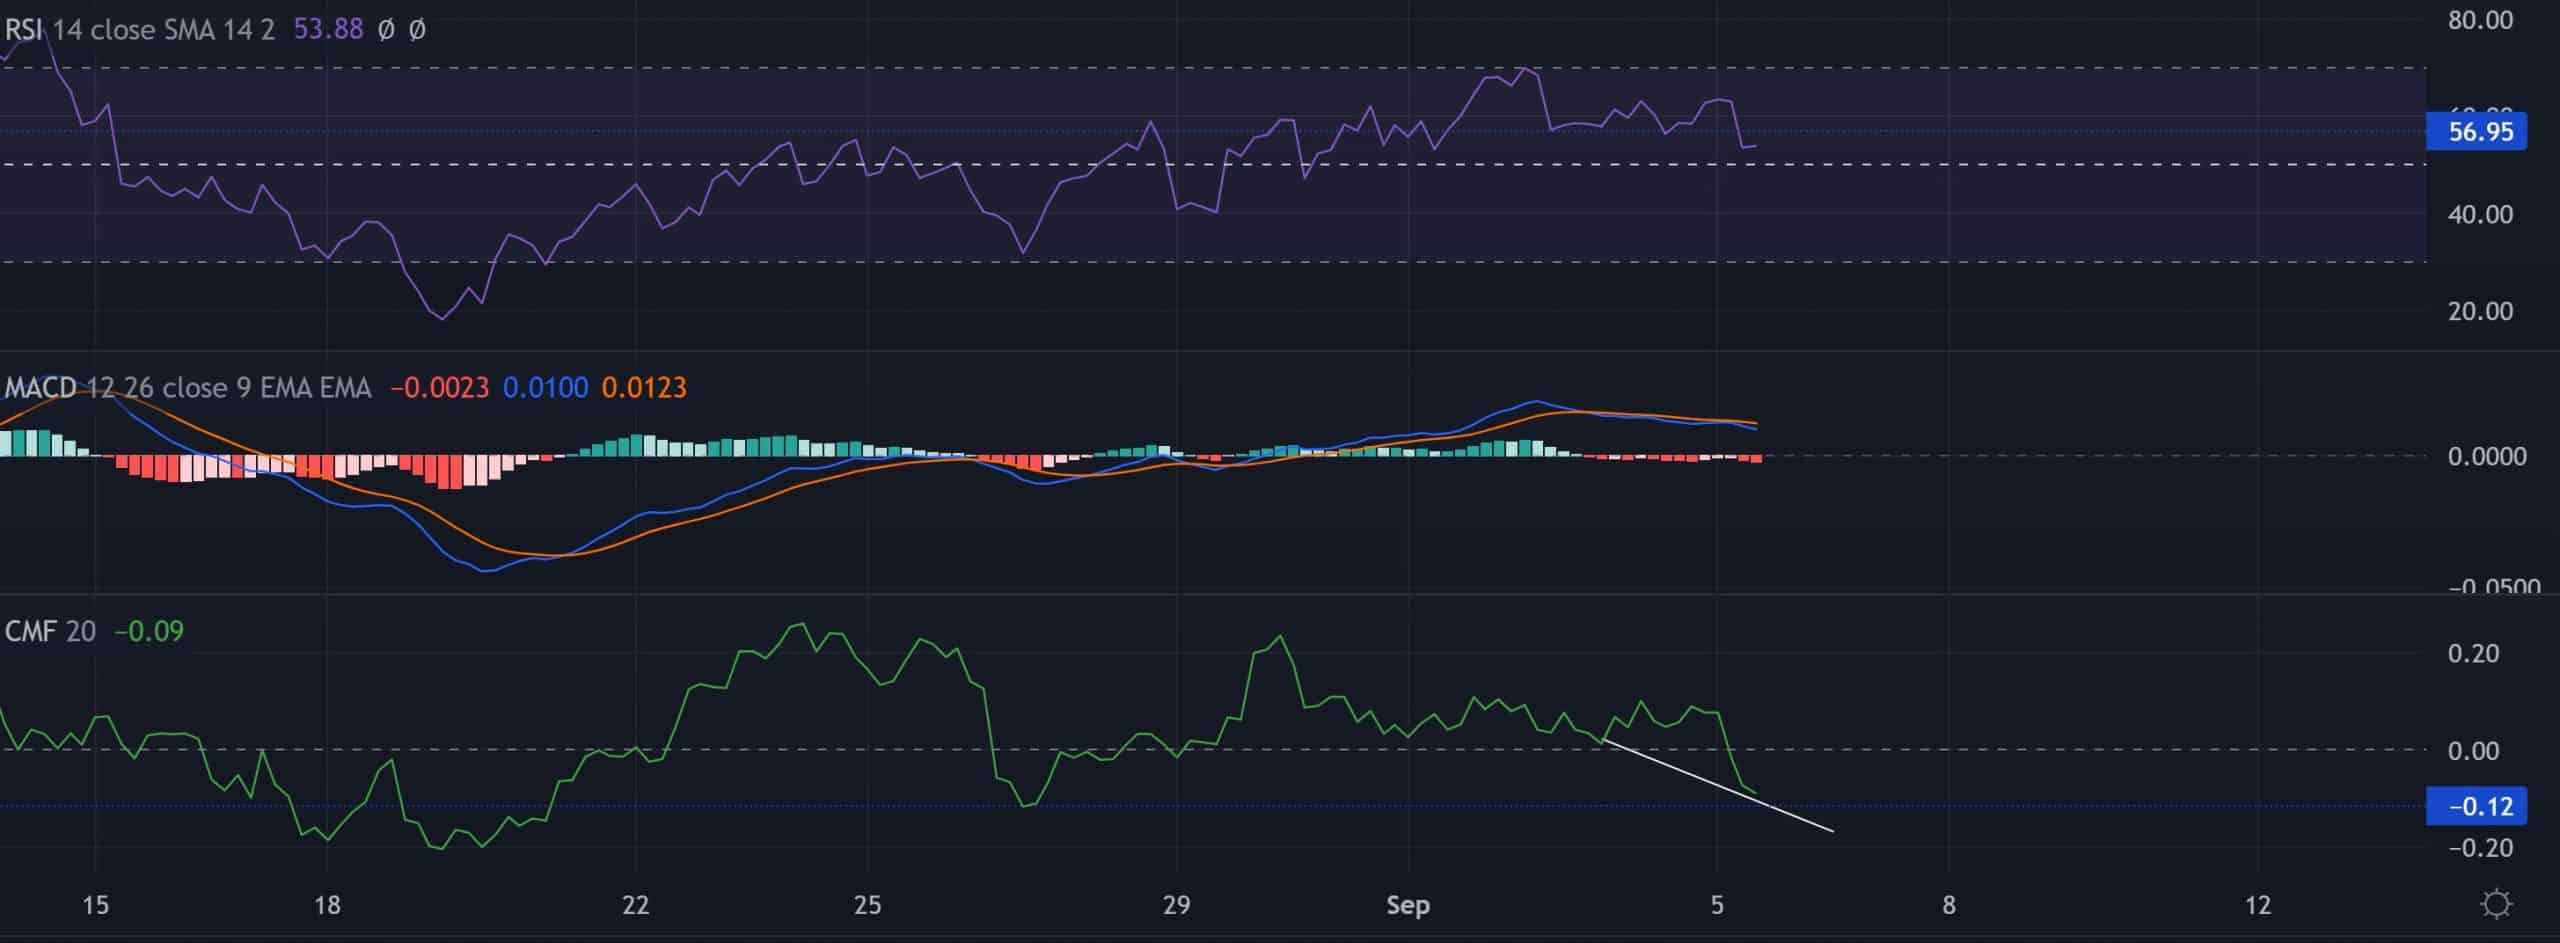
The Relative Strength Index (RSI) dipped below the 56-level resistance to depict a decrease in buying edge. Any decline below the equilibrium would confirm the press time bearish bias.
The MACD’s bearish crossover inflicted south-looking inclinations. A continued drop would resonate with RSI’s bearish stance.
Nevertheless, the CMF’s lower troughs had the potential to affirm a bullish divergence with the price. But for this, the bulls must uphold the -0.12-level.
Conclusion
MATIC’s decline below the ascending channel after an evening star candlestick pattern hints at a potential bearish move. The fall below $0.97 could confirm this narrative. The targets would remain the same as discussed.
Finally, investors/traders must keep a close eye on Bitcoin’s movement as MATIC shares a 75% 30-day correlation with the king coin.


