Shiba Inu, Chainlink, EOS Price Analysis: 24 November

The broader market typically displayed conflicting signs with a bearish edge. Consequently, Shiba Inu touched its one-month low on 24 November.
On the other hand, after touching their weekly lows on 18 November, Chainlink and EOS flashed some revival signs. But the bulls seemingly failed to sustain a continued rally.
Shiba Inu (SHIB)
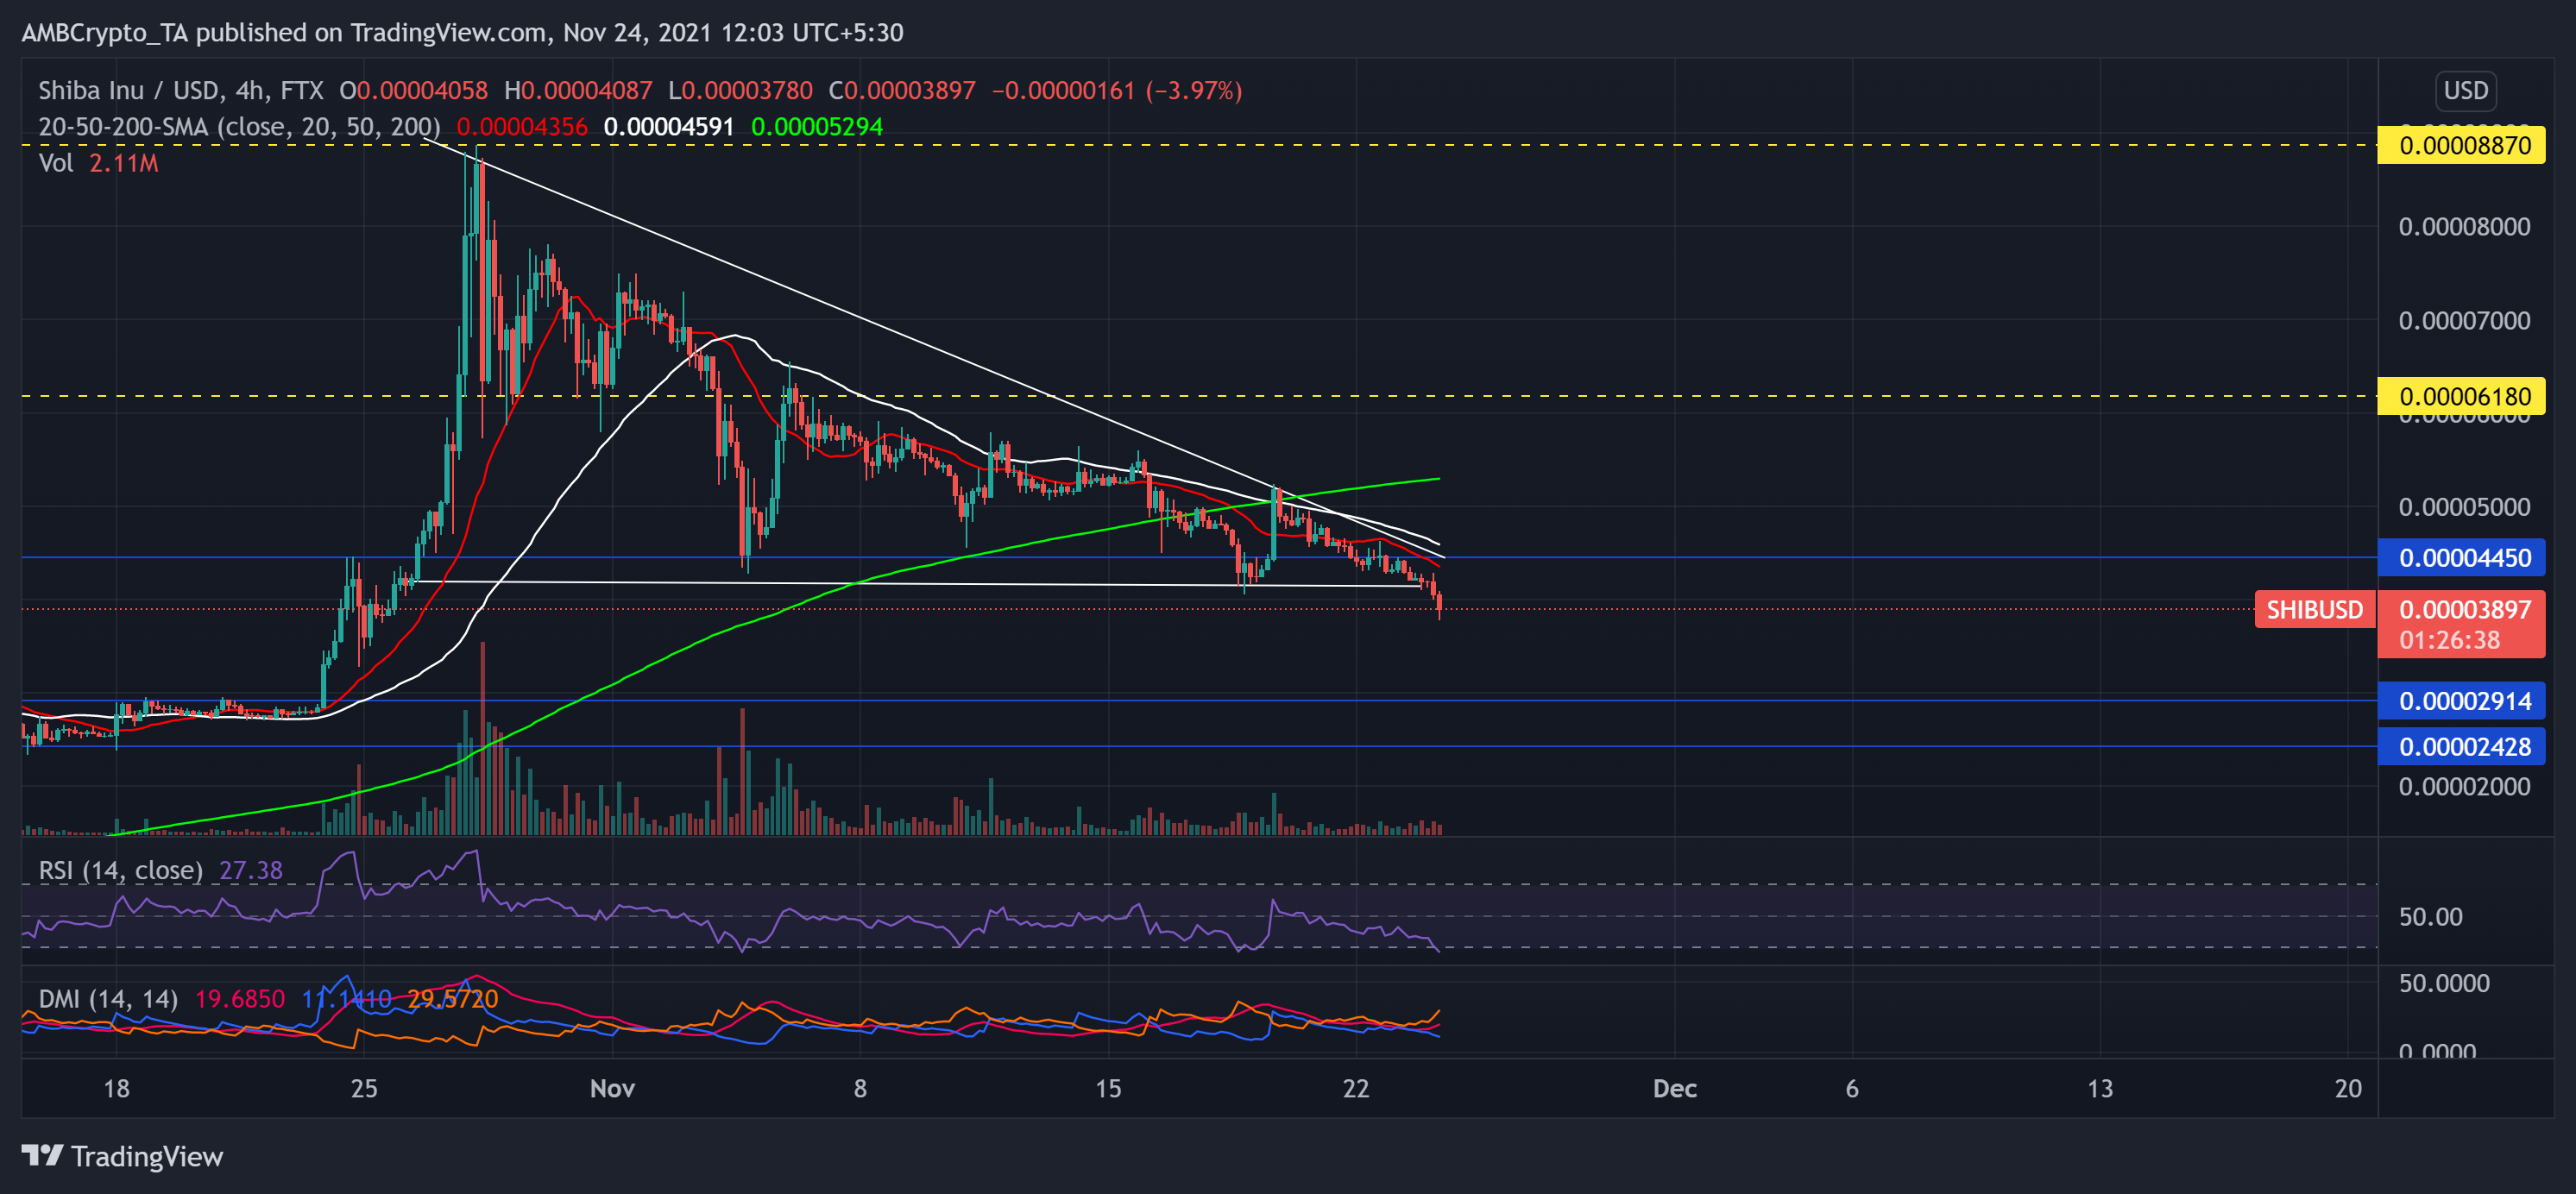
Post an over 200% October-end rally, the meme-coin has firmly downturned after striking its ATH. SHIB descended in a triangular pattern throughout this month. During this phase, the alt lost over half of its value from 28 October to 24 November.
However, on 19 November, SHIB saw a nearly 13.76% jump. But bulls failed to hold their ground as the coin saw a 24.4% decline in just five days. Consequently, it touched its one-month low on 24 November.
At press time, SHIB traded at $0.00003897. The price transacted below its 4-hour 20-50-200 SMA, indicating the existence of bearish influence. The RSI, after a steady decline since last week, stood at the oversold region. Also, the DMI visibly chose the sellers after depicting their increased vigor. Nevertheless, the ADX displayed a weak directional trend.
Chainlink (LINK)
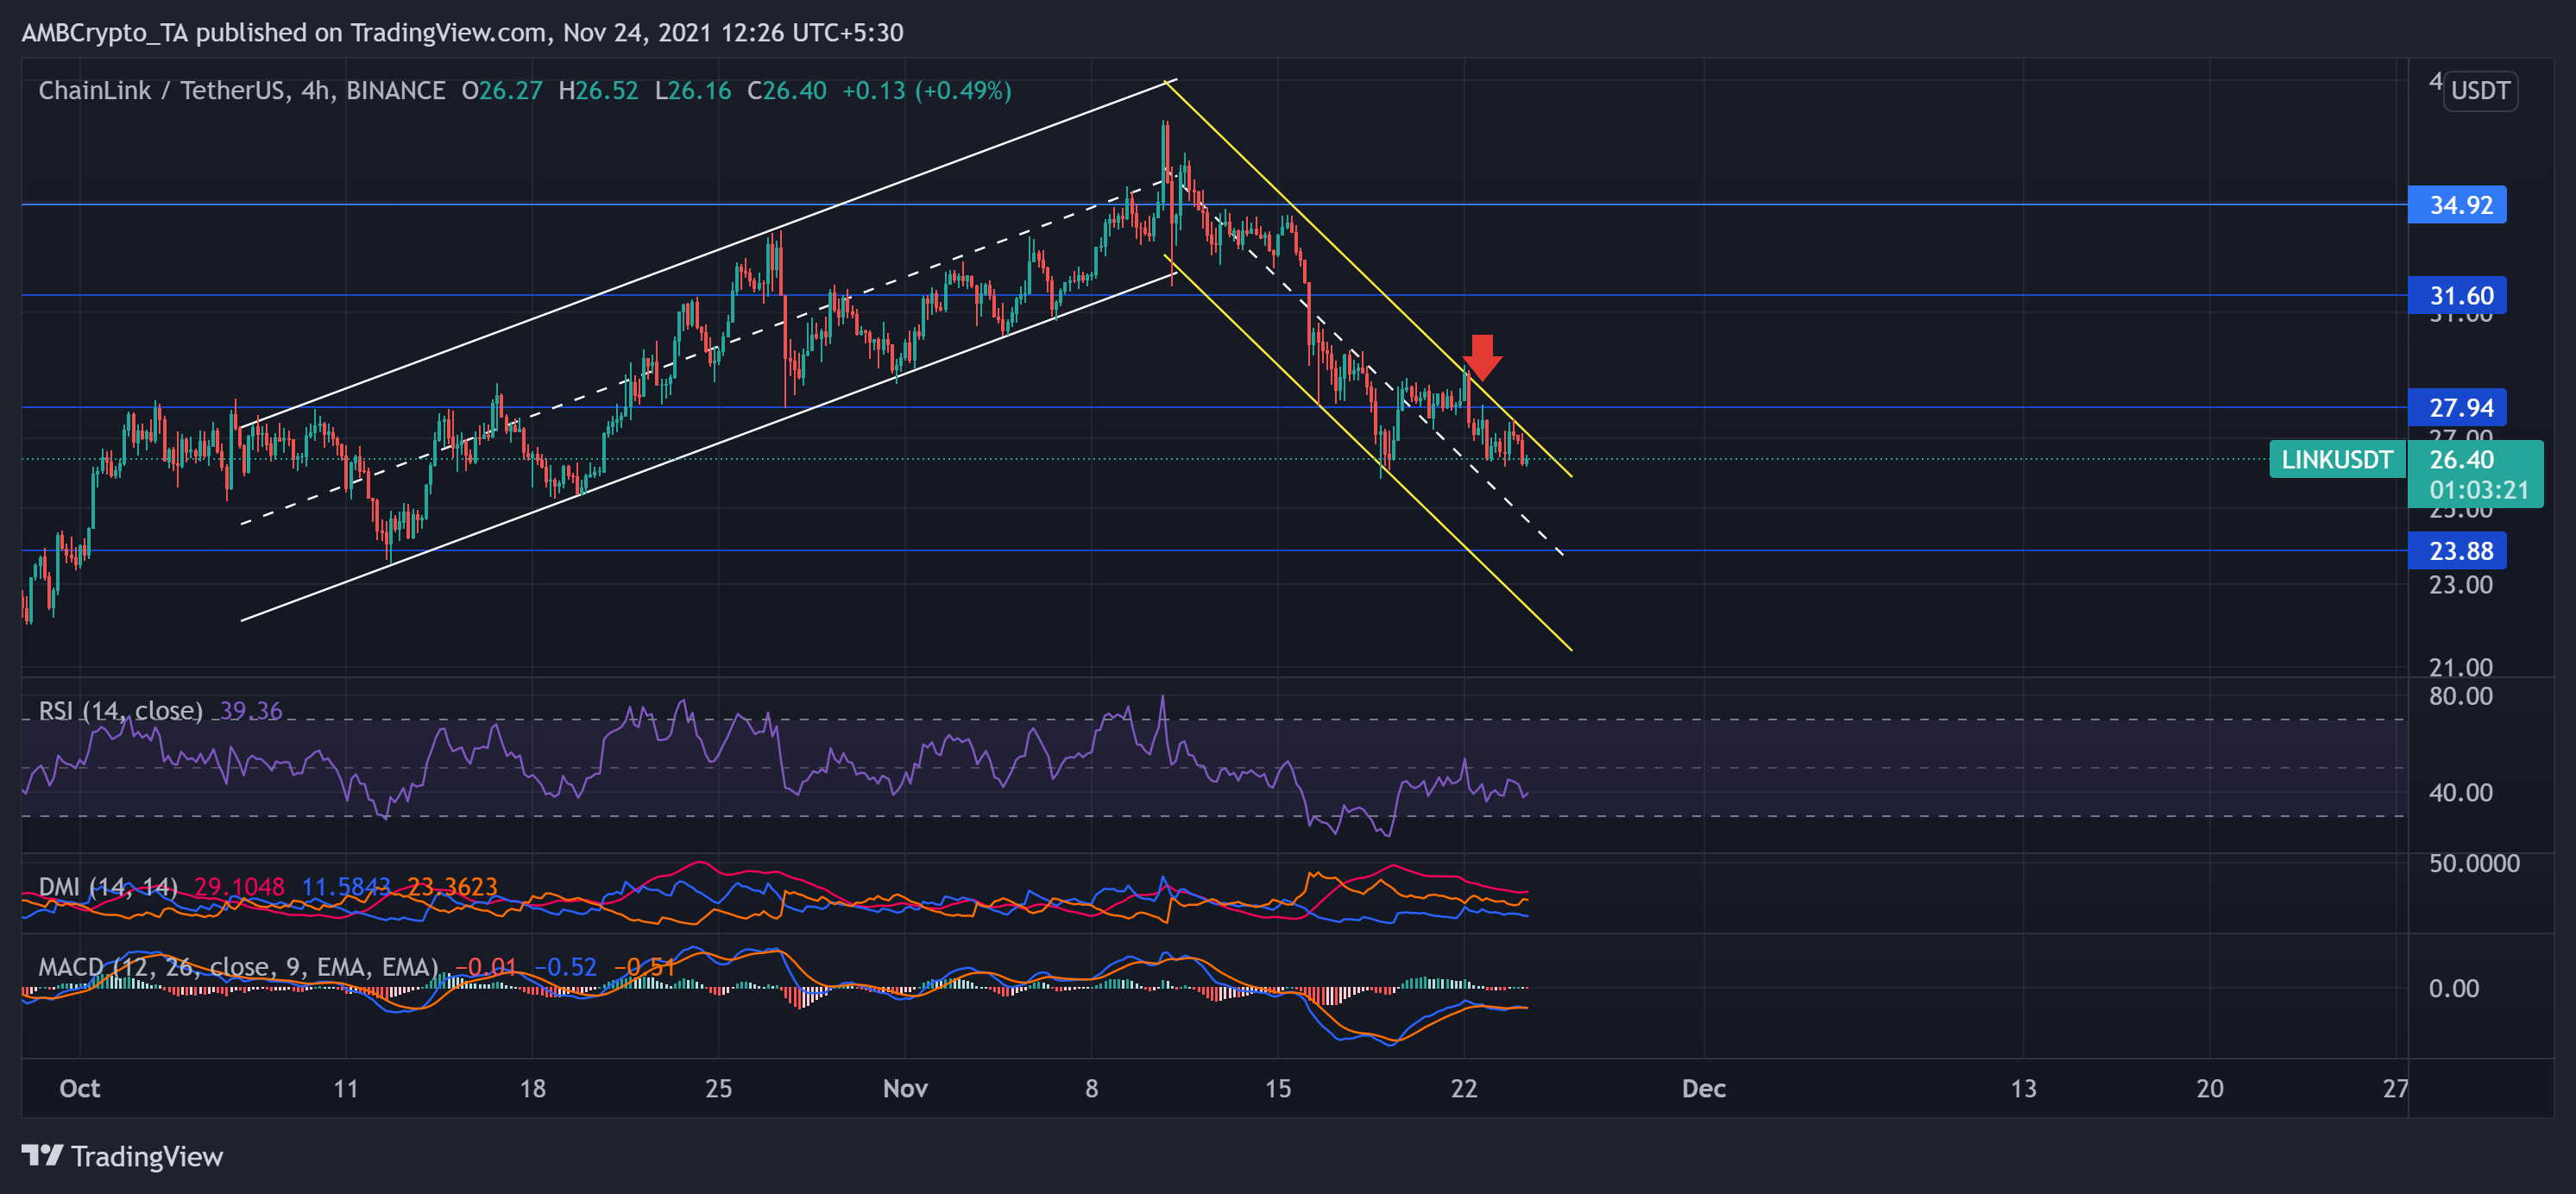
LINK correlated with the market trend by marking a pleasant October. The alt upturned after noting a monstrous 62.08% ROI from 12 October to 10 November. With this, the bulls successfully achieved a six-month high on 10 November at $38.31. Since then, bears triggered a downfall as the price moved between the southern channel (yellow).
During this sell-off phase, LINK lost over one-third of its value. The bears constantly breached new resistance points to touch LINK’s one-month low on 18 November. After which, the bulls attempted a revival by marking a 10% rally from 18 November to 22 November. But the price action obliged the downtrend as it bounced back from the upper line of the down channel.
At press time, LINK traded at $26.4. The RSI was at the 39-mark and undeniably showed a bearish advantage. Further, bearish readings on the DMI and MACD reaffirm the price action downtrend.
EOS

After relishing an October upturn of over 25%, the price ascended in an up channel (white). As a result, EOS hit its seven-week high on 10 November.
However, the price action obliged the larger trend by stepping back into it. As a correction phase kicked in, EOS witnessed a descending triangle pattern (yellow). The alt saw a 27.74% withdrawal over the next week until it hit its three-week low on 18 November.
At press time, EOS was trading at $4.172. After a steady downtrend, RSI displayed recovery signs as it headed north and stood near the midline. Additionally, DMI displayed a bearish inclination. However, MACD and AO showed possible signs of easing the bearish mood.