Terra, Tron, Litecoin Price Analysis: 23 December

As Bitcoin registers a 7.19% three-day rise at press time, altcoins like Tron and Litecoin bagged similar gains to flip their 20-SMA’s as immediate support levels. The king coin would need an uninterrupted volume-backed rally to reverse the current sentiment and with it, the overall market trajectory.
Contrarily, Terra entered into price discovery and poked its ATH on 22 December.
Terra (LUNA)

LUNA witnessed a massive upturn after a down-channel breakout on 14 December. Since then, the alt aggressively rose between two parallel channels heading north and showed no correction signs at press time. It saw an over 89.05% ROI (from 14 December low) until it touched its ATH on 22 December.
The 20-SMA (red) stood as excellent support for the alt during the upturn. Over the past day, the bears tested the $83.6-level, but the bulls found support at the 23.6% Fibonacci mark. Meanwhile, it became the ninth-largest crypto in terms of market cap.
At press time, LUNA traded at $90.34. The RSI wavered around the overbought region from 18 to 22 December. Even after a downfall, it did not show loosening signs. Also, the OBV affirmed the buying power. However, the Volume Oscillator moved sideways during the recent rally rather than rising.
Tron (TRX)
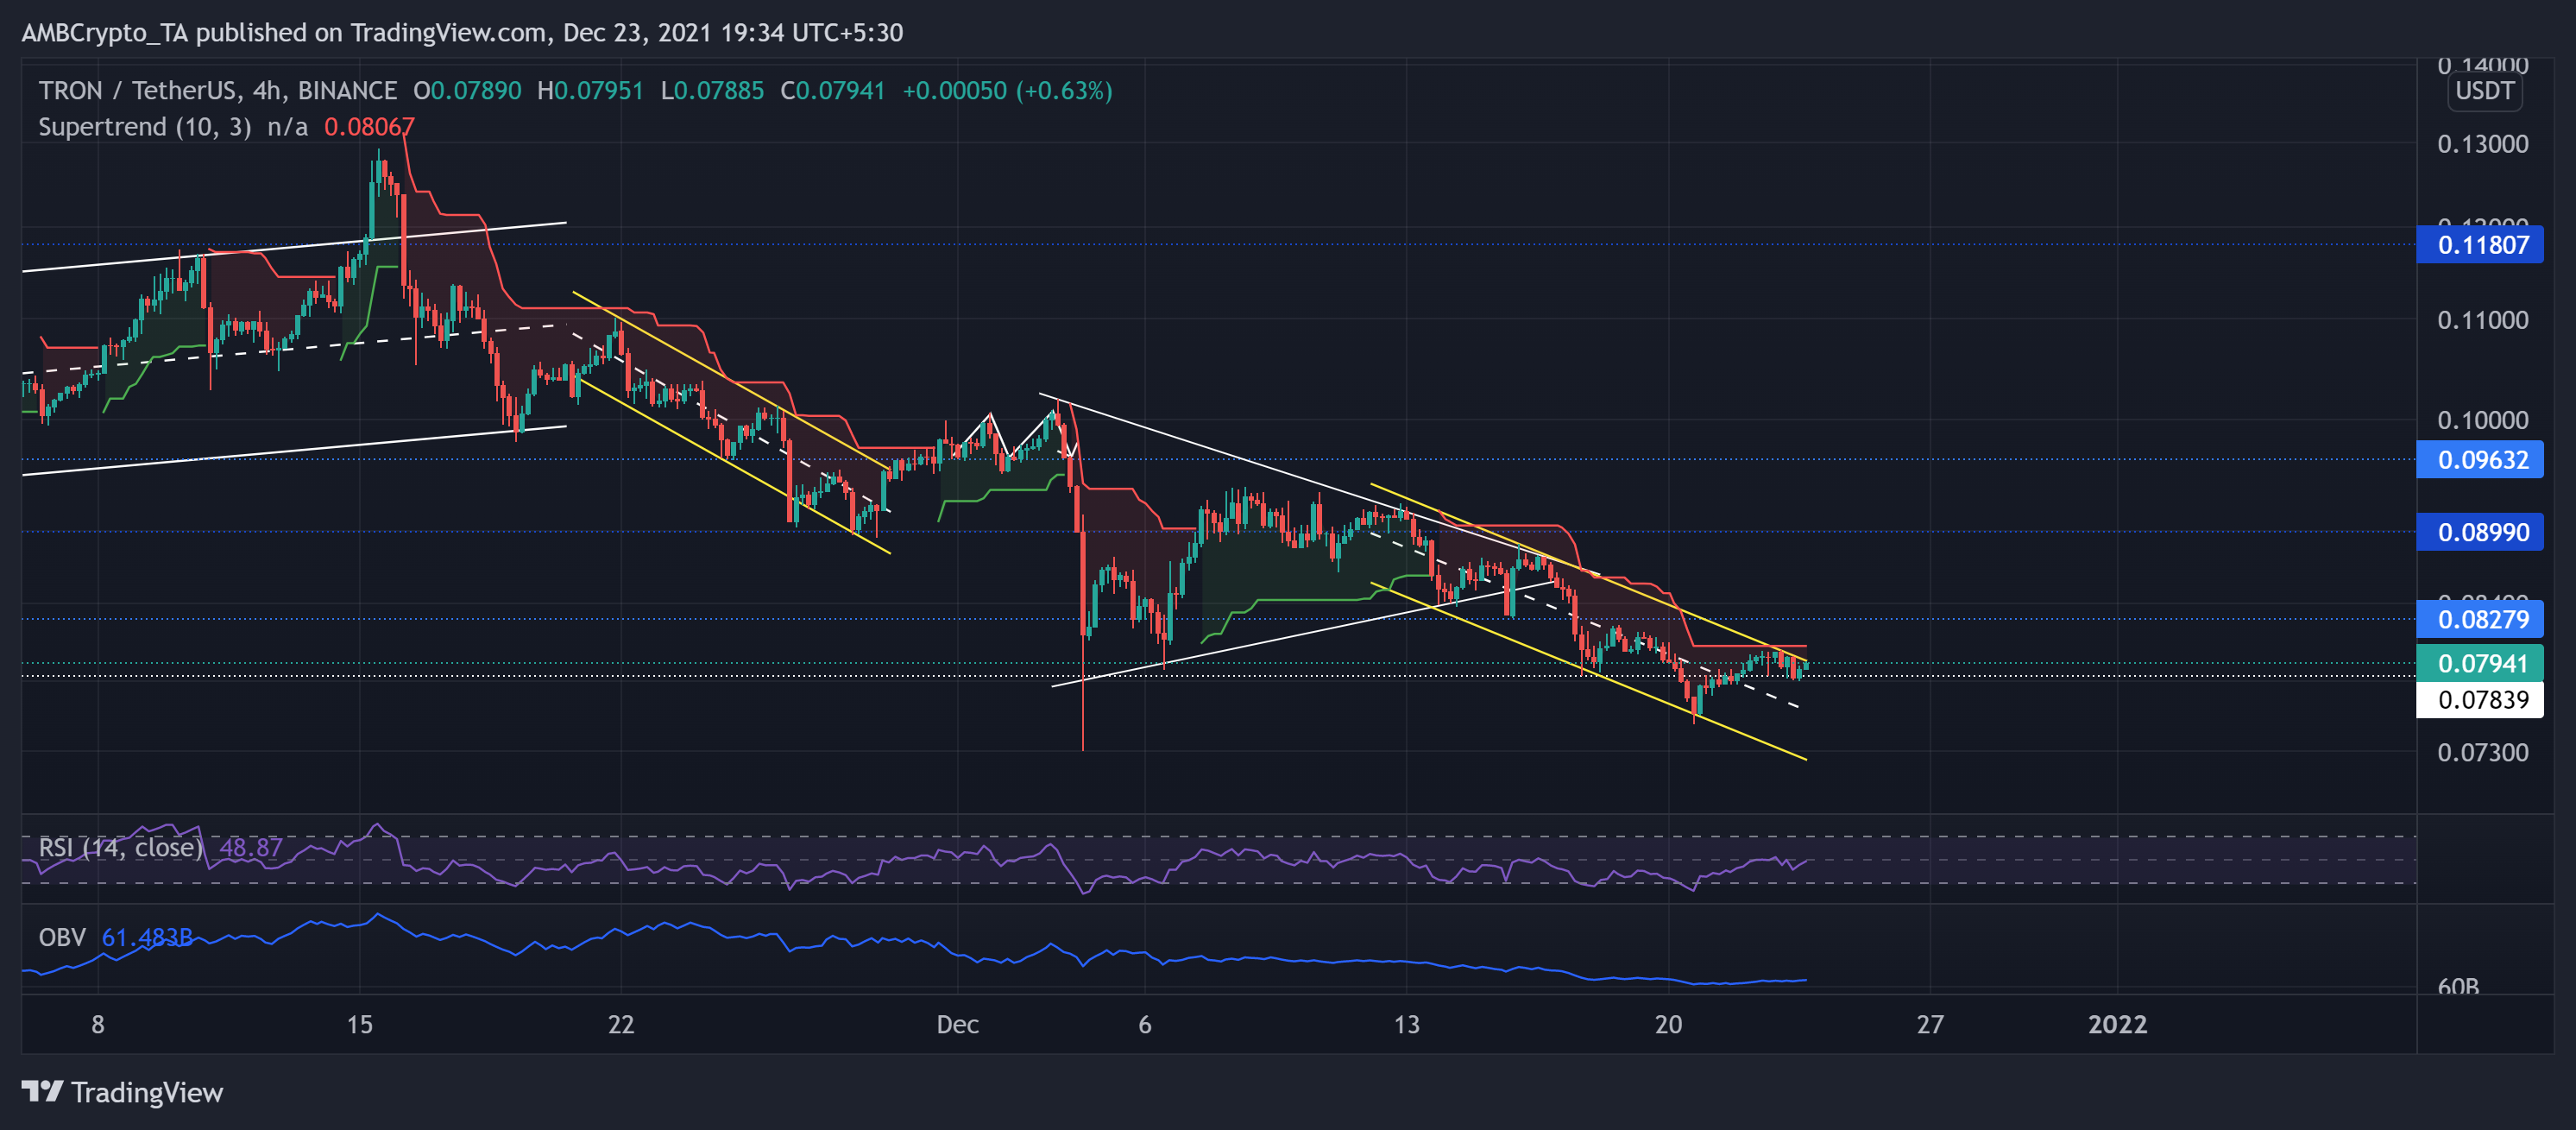
TRX witnessed a symmetrical triangle breakdown on 17 December while the fear sentiment surged. This fall happened after the news of Justin Sun stepping down from his duties at the Tron Foundation.
The alt saw an over 9% decline over the past week as TRX marked a down-channel (yellow). The altcoin lost the crucial $0.078-level, which the bulls upheld for over four months. However, the bulls managed to reclaim the above level as immediate support.
No surprise to see the Supertrend being in the red zone and flashing sell signals. At press time, TRX traded at $0.07941. The RSI continually found resistance at the midline and struggled to cross it. The OBV wavered around its seven-week low and reaffirmed the decreased buying pressure.
Litecoin (LTC)
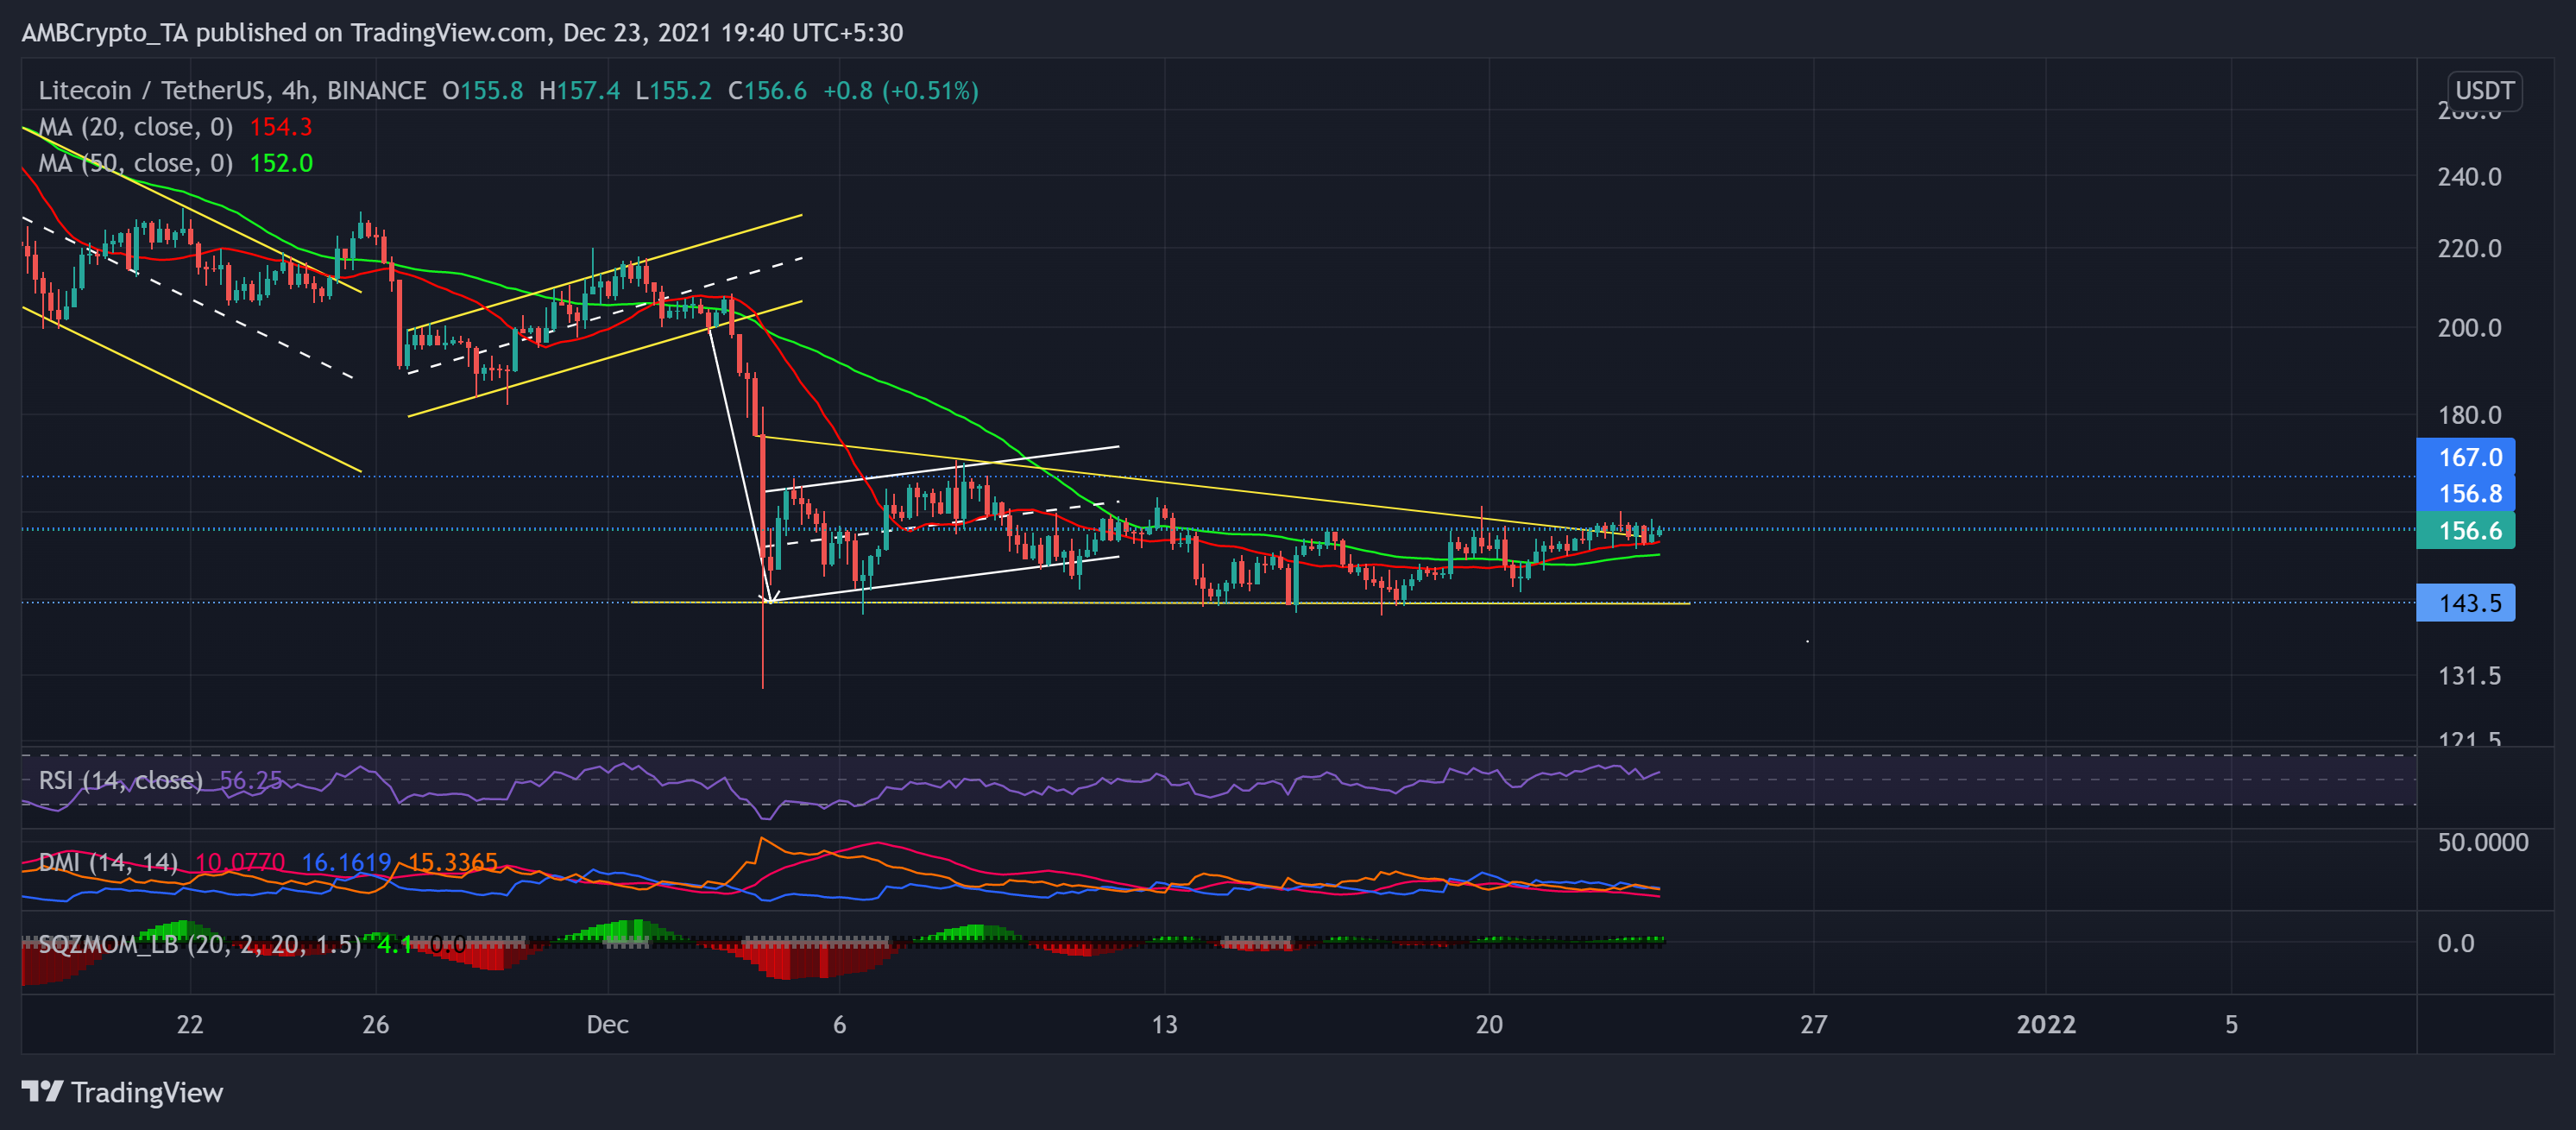
After an expected bearish flag breakdown, the price action found an oscillating range between the $143 and $156-mark. Over the past 18 days, LTC formed a descending triangle by marking lower highs while maintaining the $143.5 support.
However, after a nearly 7% three-day jump, it invalidated its bearish tendencies and flipped its 20-50 SMA as immediate testing support levels.
At press time, LTC traded at $156.6. The RSI sustained above the midline over the past day. Moreover, the DMI lines depicted a marginal bullish preference but a weak directional trend. The Squeeze Momentum continued to hint at the squeeze phase with low near-term volatility.