Tezos, BAT, VeChain Price Analysis: 10 July

Tezos’s price rose by 3.6% in 24 hours and noted some buying pressure on the charts. BAT, after oscillating within a tight price range, started to lose value and hinted at increased market volatility. Finally, despite a significant drop in price, VET noted a hike in capital inflows over outflows over the last 24 hours.
Tezos [XTZ]
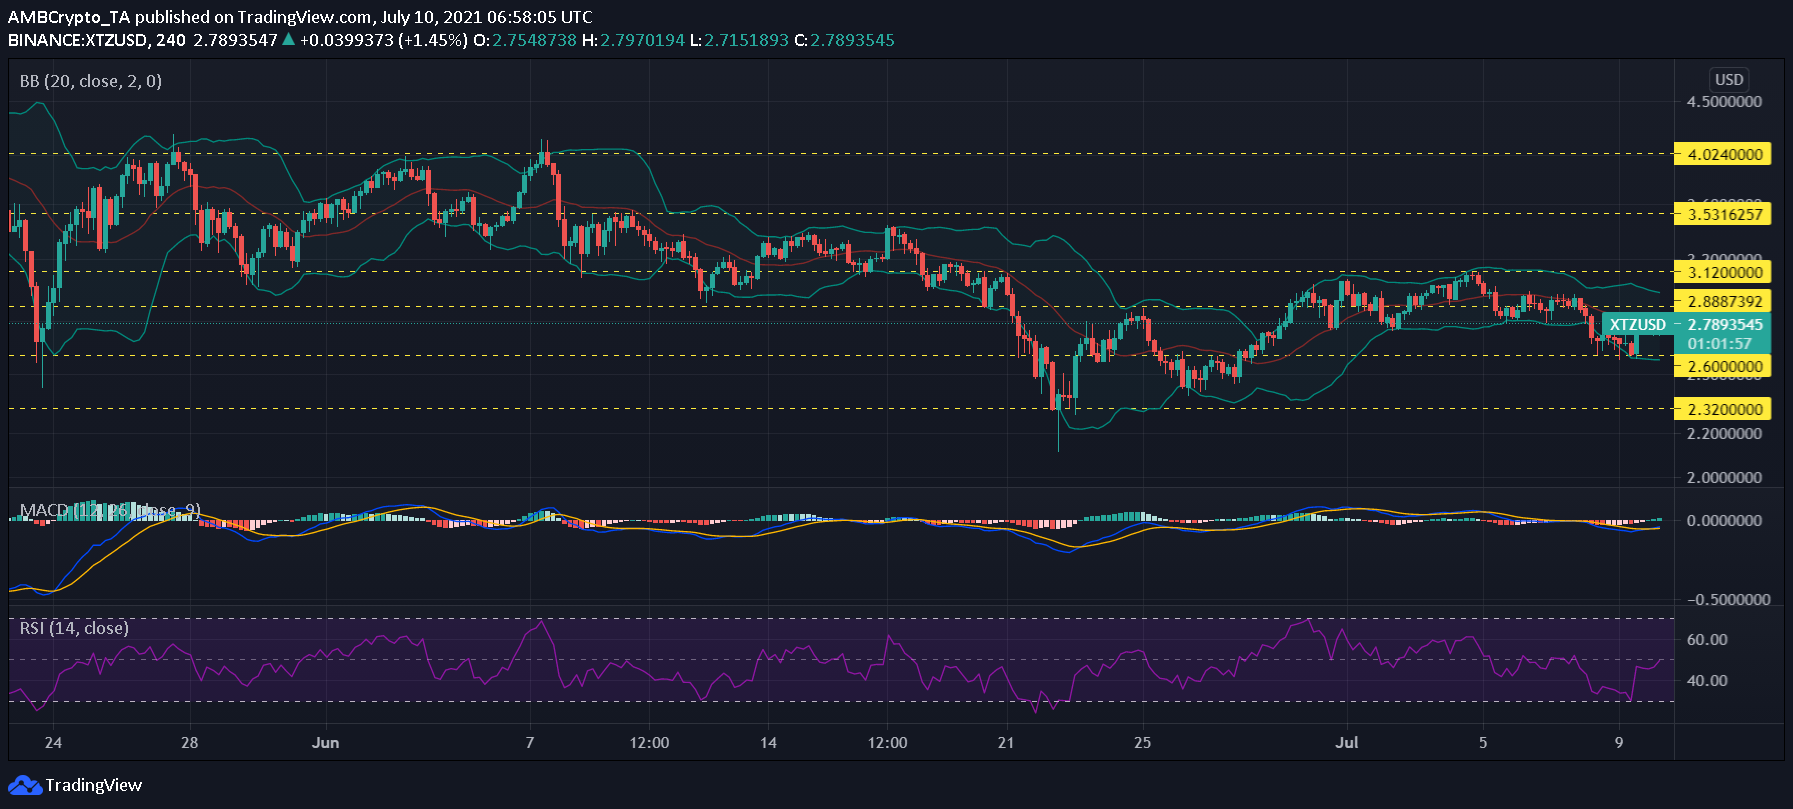
Tezos was trading at $2.77 on the back of a 3.5% hike in 24 hours. The token broke the $3 resistance level on 4 July and then eventually found support near the $2.32 support range, despite the aforementioned hike. At press time, the asset was still a little close to the $2.32 level. Tezos’s market capitalization was at $2.34 billion.
The Relative Strength Index underlined the growth in buying pressure and with demand on the rise, the price could go up and test the $3 resistance level again. Minor convergence on the Bollinger Bands indicated that price volatility was going down slightly. This reading suggested that the crypto could hover around the same price level over the next few trading sessions.
On 9 July, the MACD indicator pictured a bullish signal, with the histogram registering the onset of short-term bullish momentum.
Basic Attention Token [BAT]
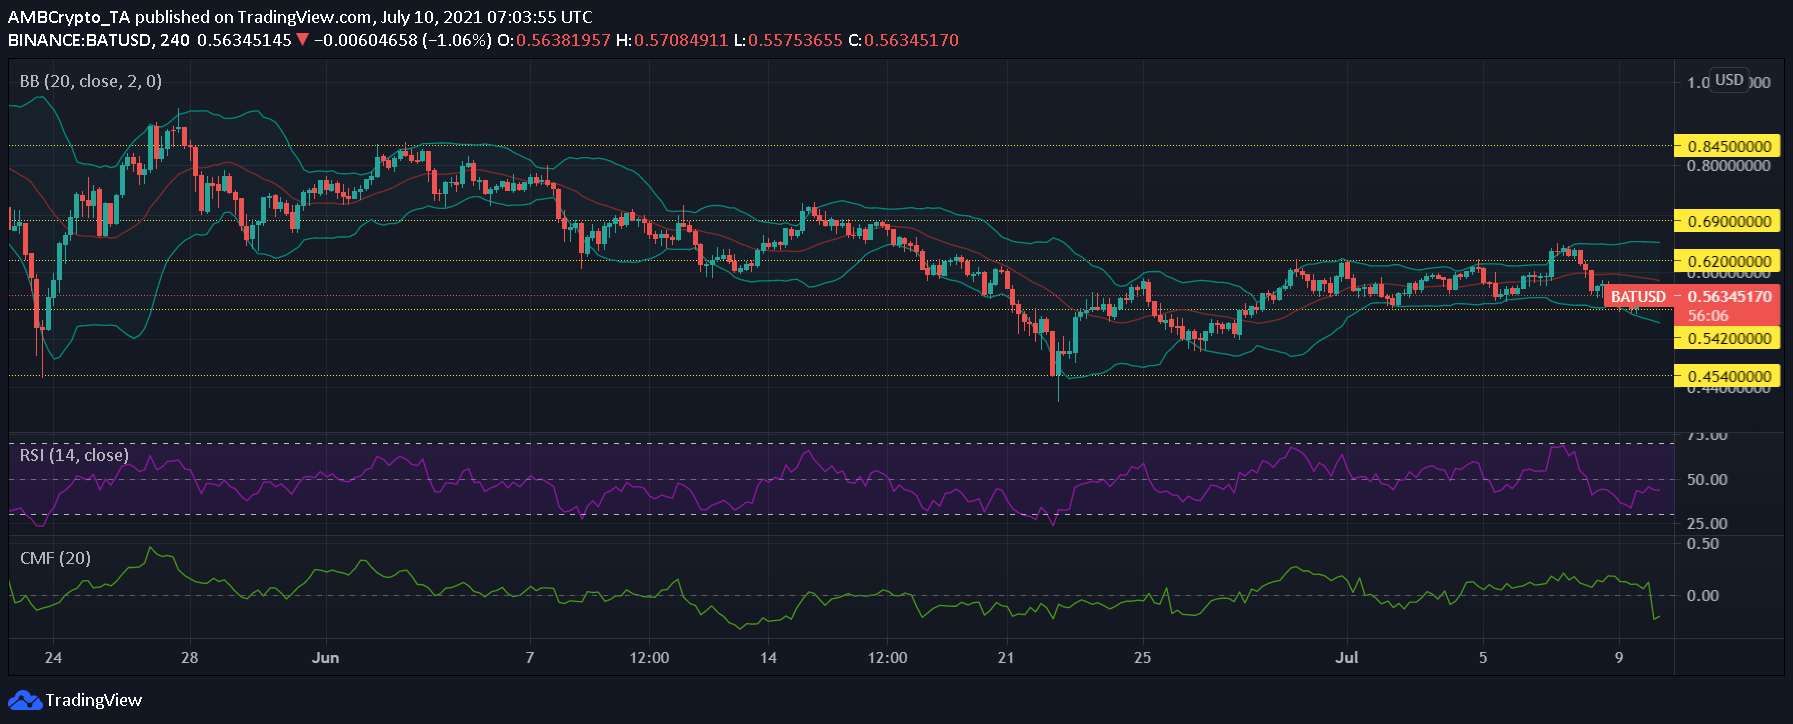
BAT’s range-bound movement broke and the altcoin was finally trading above the $0.62 resistance level. Subsequently, however, the crypto fell in value and rested on the support level of $0.54. At the time of writing, BAT was trading at $0.56 on the back of a 2.2% hike in price.
The Relative Strength Index demonstrated a sharp fall from high buying pressure to increased selling pressure on 7 July. However, the altcoin recovered from a point of increased selling pressure, even though the market still had more sellers in comparison to buyers at press time.
Since selling pressure was dominant, capital inflows dropped while capital outflows increased, even though the Chaikin Money Flow did note a slight uptick at the time of writing. The Bollinger Bands projected some degree of market volatility going forward.
VeChain [VET]
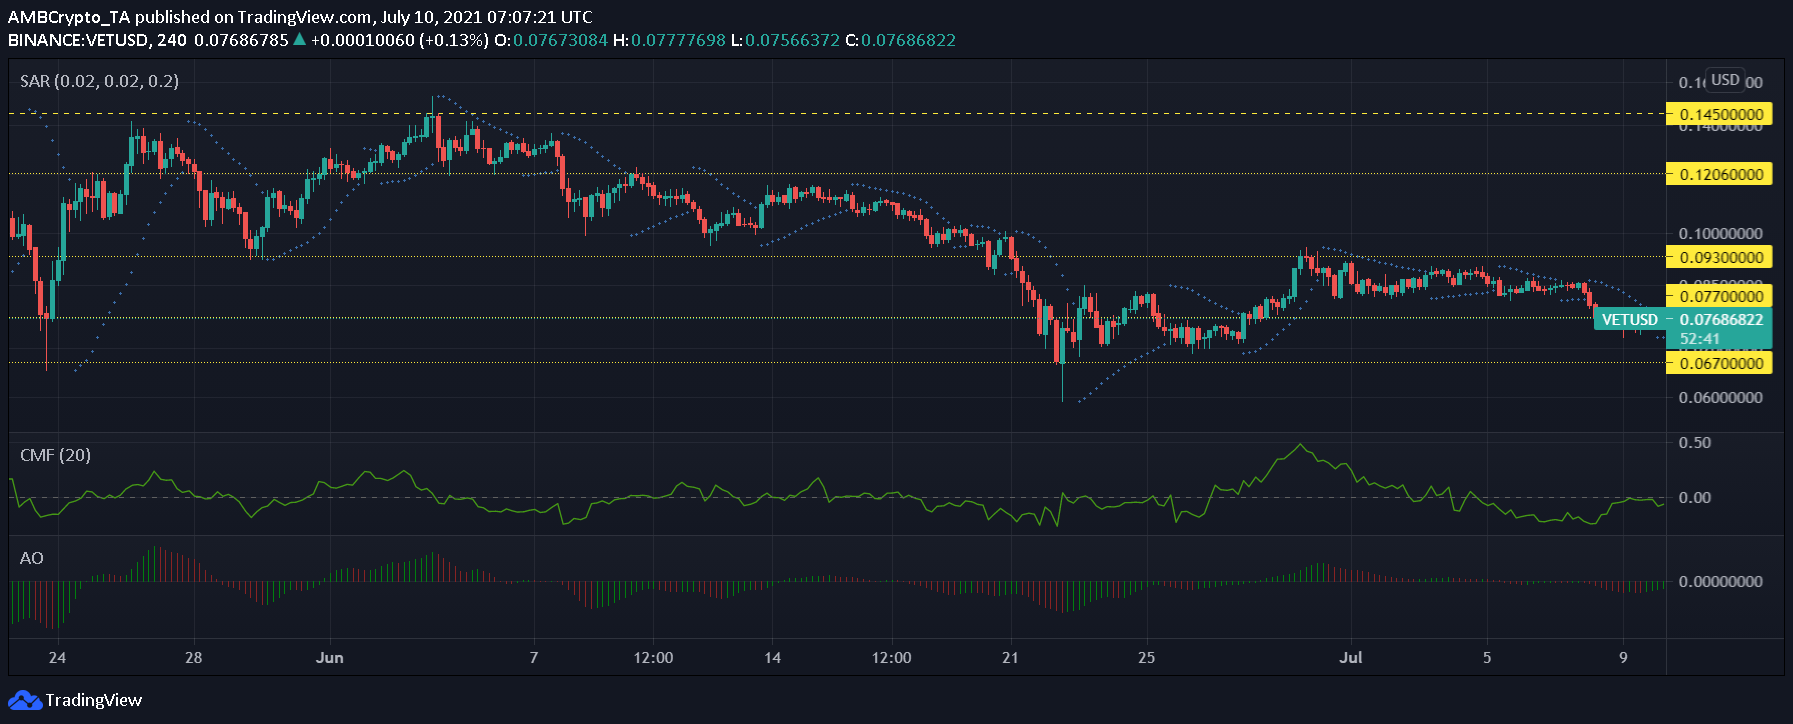
VET’s price was sandwiched between the $0.93 resistance and $0.77 support level. However, at press time, the altcoin was trading at $0.76. If VET’s downtrend continues, it will fall through the $0.77 level and find support on the $0.67 level. The dip in price on 9 July made traders look at that as an entry point in the market. In correspondence to the same, the Chaikin Money Flow registered an increase in capital inflows over outflows, before recovering somewhat.
The Awesome Oscillator gave away mixed signals as red signal bars amidst dominant bullish pressure were spotted intermittently. Interestingly, even though the asset wasn’t yet free of a downtrend, it increased in value over the last 24 hours by 2.85%. Thanks to the same, the Parabolic SAR’s dotted markers switched to below the candlesticks too.


