Tezos, Waves, Dash Price Analysis: 26 August

The broader market was in a state of indecision after Bitcoin kept its neck above $47,000. Tezos shot up by 12.4% as it attempted to move upwards to test the $5.08 price ceiling. Waves and DASH, on the contrary, reversed their recent losses by just 0.3%.
With a sustained downtrend, WAVES could attempt to trade below its $22.10 support line and DASH cut below the $251.85 price floor.
Tezos [XTZ]
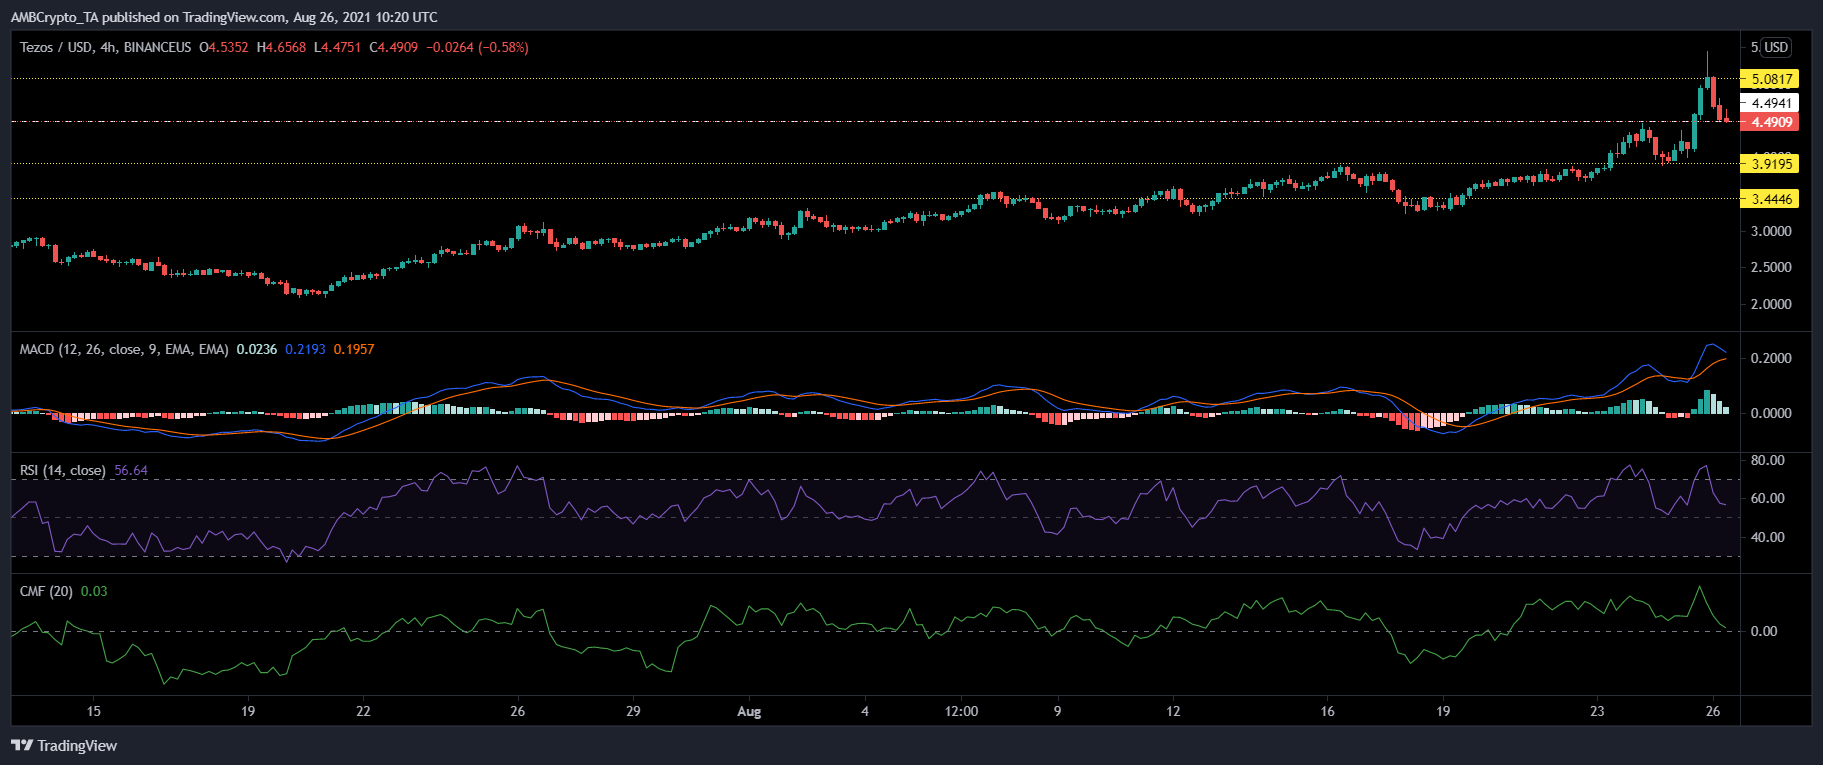
XTZ gained by 12.4% and was trading at $4.49 after falling below its $4.50 support line. The price of XTZ was around the said level last on 19 May and with a sustained uptrend, XTZ could attempt to test $5.08 for the third time since 19 May.
The MACD witnessed a bullish crossover and pictured green histograms. The Relative Strength Index fell sharply from the overbought zone. However, it remained well above the half-line and within the bullish territory.
The Chaikin Money Flow noted a decline in capital inflows. Even so, it remained above the midline.
In case of a price correction, XTZ could fall and find support around the $3.91 and $3.44 levels.
Waves
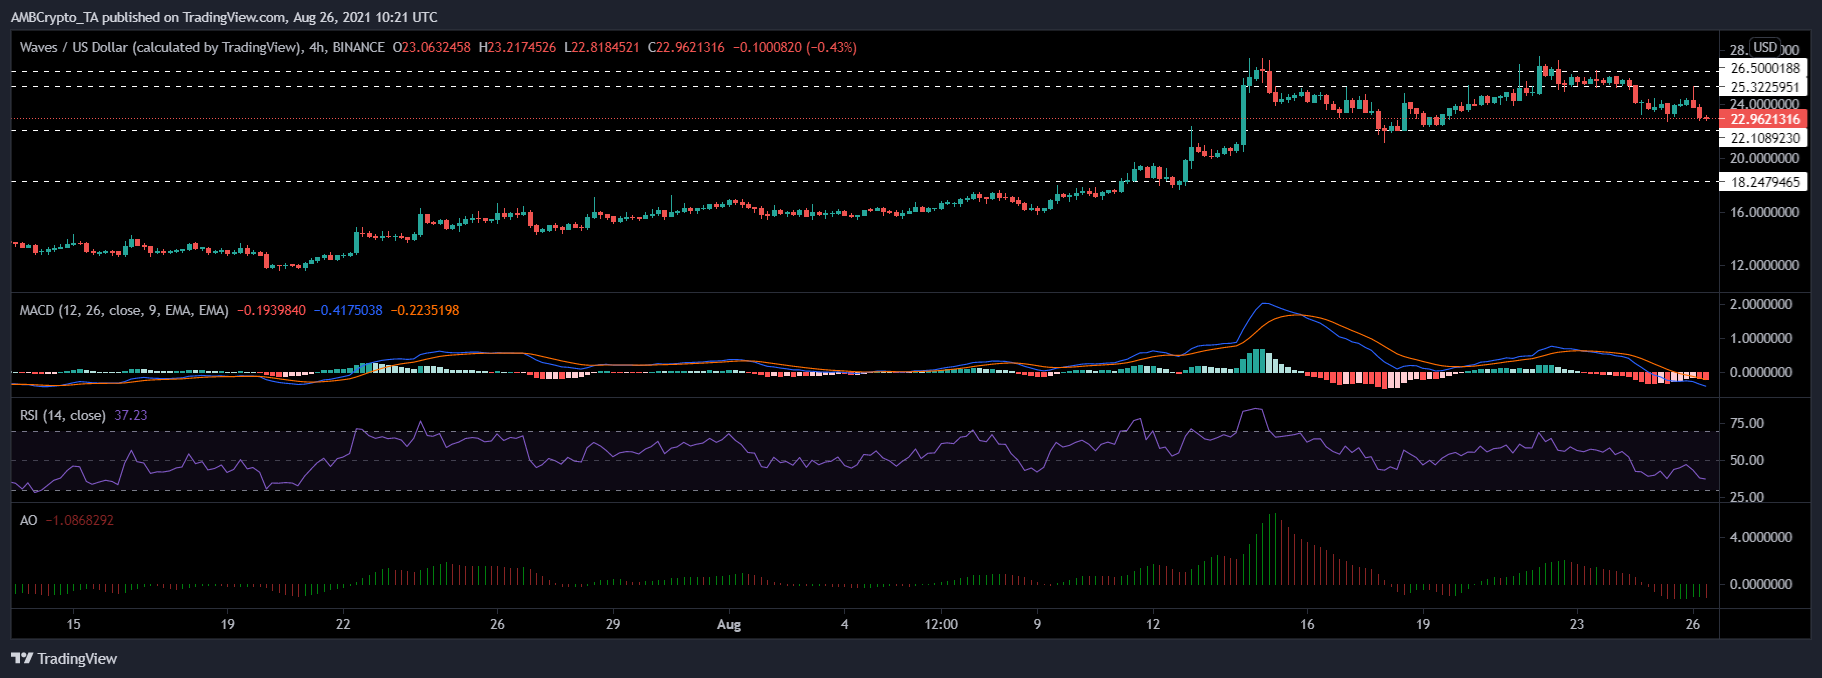
Waves reversed its recent losses by 0.3% over the last 24 hours. The altcoin was trading at $22.96 and despite some recovery, it eyed cutting below its $22.10 price floor. Waves continued to see bearishness on its indicators.
The MACD emanated red signal bars highlighting that the alt’s price was still moving in a downward direction. Buying pressure also dipped over the last 48 hours and was pictured below the half-line, at the time of writing.
The Awesome Oscillator also flashed one red signal as it attempted to recover above half-line.
In case Waves finds some upside, it could encounter resistance at $25.32 and then $26.50.
DASH
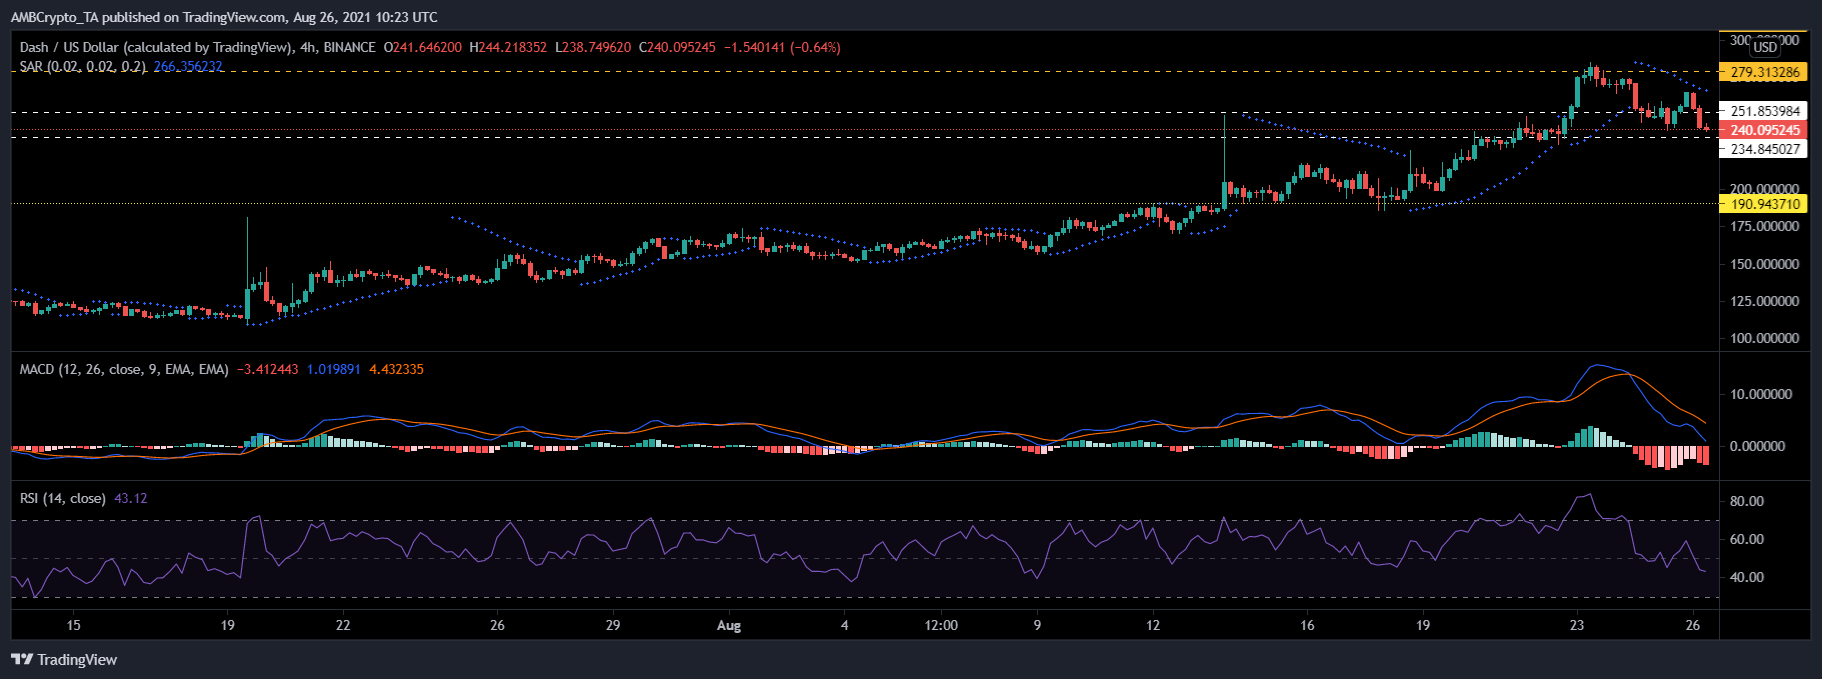
DASH rose by 0.3% over the last 24 hours as it traded at $240.09. Even though the token attempted to reverse the losses incurred over the last few trading sessions, it fell below its $251.85 support line. With sustained southbound price action, the immediate support level for DASH lay at $234.84.
Technicals for DASH also verified a downtrend. The MACD noted red histograms while the Relative Strength Index neared the 40-mark, highlighting a fall in buying pressure.
The Parabolic SAR, in accordance with the same, displayed dotted lines above the candlesticks.
In case of a price reversal, DASH could attempt to topple the $251.85 resistance and test the $279.31 price ceiling.


