The A to Z of Aave’s buying opportunity over lower timeframes

Disclaimer: The information presented does not constitute financial, investment, trading, or other types of advice and is solely the opinion of the writer.
Bitcoin broke out above the $30.6k-range highs a couple of days ago and indicated that, in the short-term, bullish bias is likely to be the way forward. Aave also has a bullish bias of its own after it climbed past the $100 and $110-resistance levels last week.
The market structure and the lower timeframe indicators suggested that a move north is likely to unfold over the next few days. This would target the next horizontal resistance level at $140.
AAVE- 6 Hour Chart
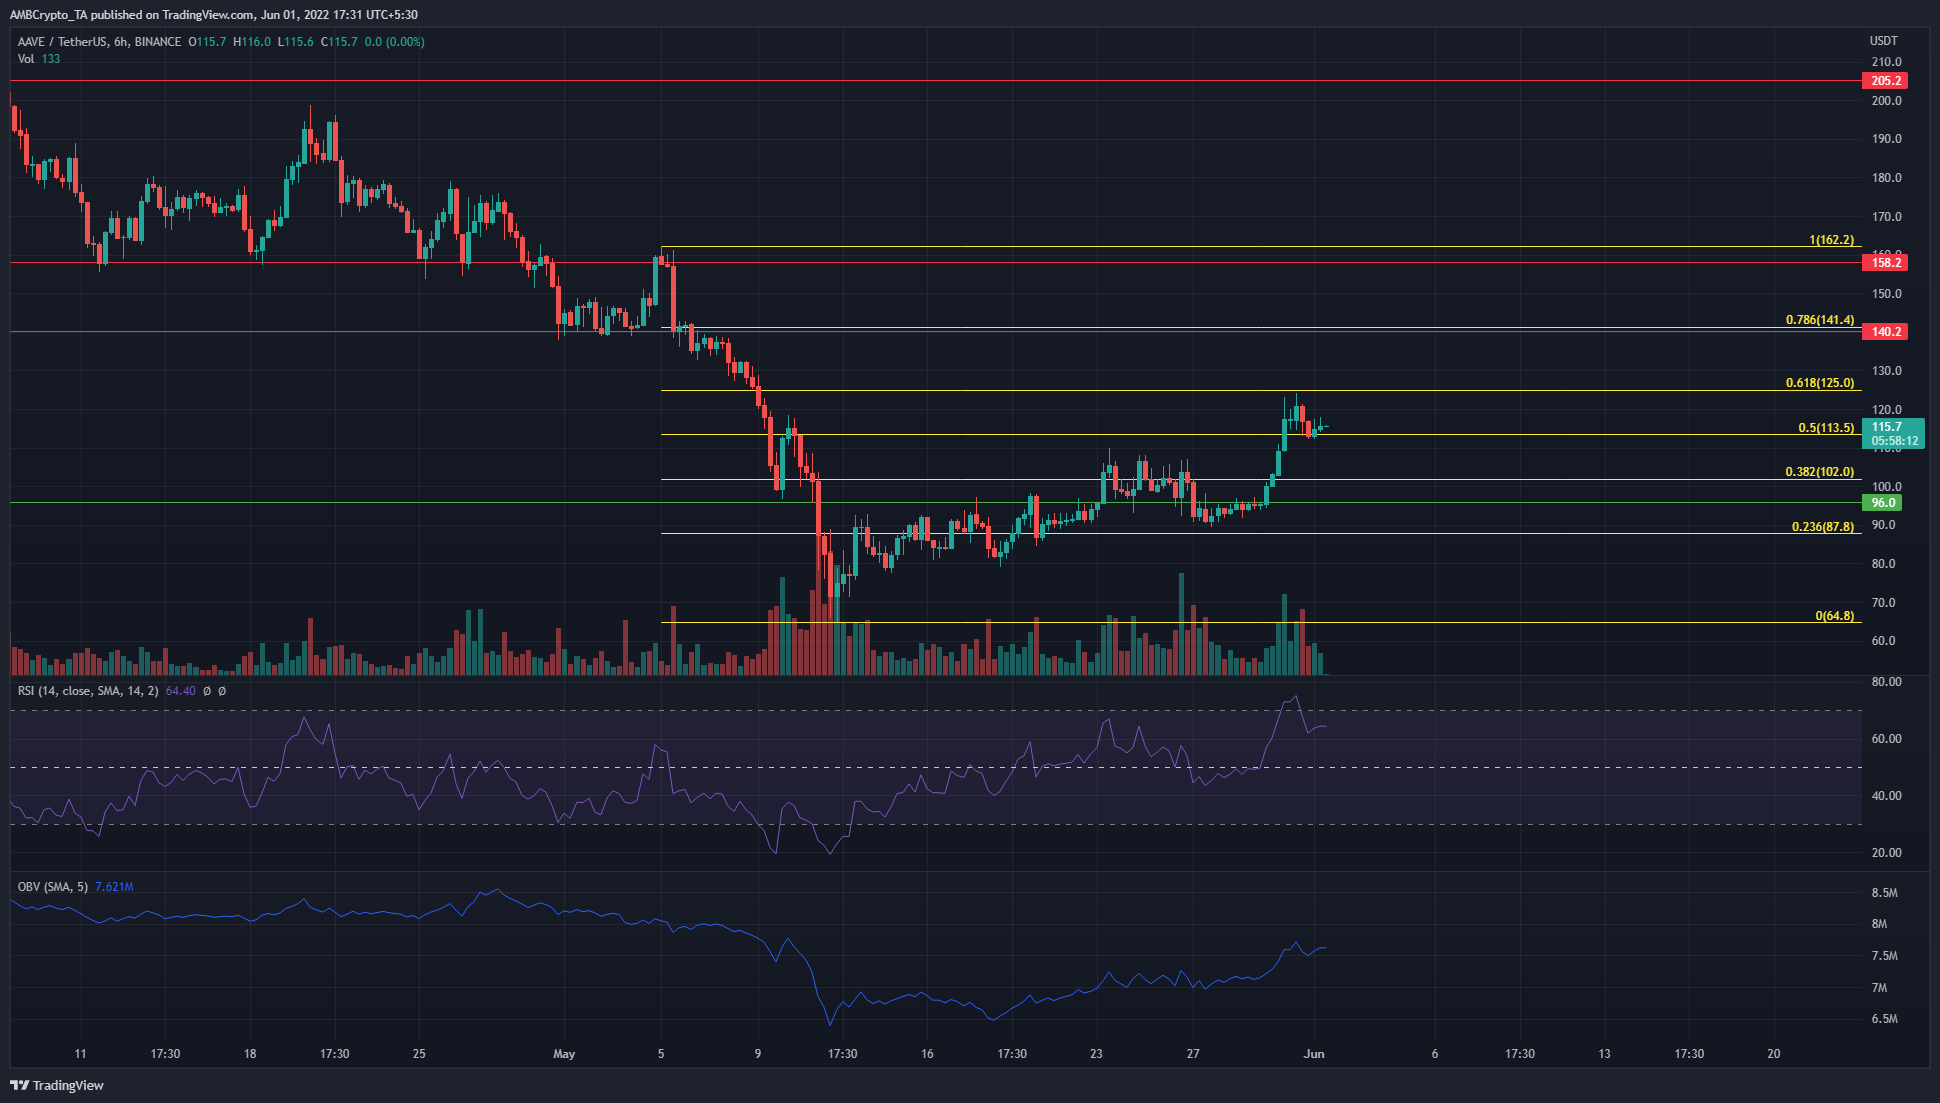
On the H6 chart, it can be seen that the price has made a series of higher lows and higher highs since the drop to $64 on 12 May. Moreover, consider the move down from $162.2 to $64.8 earlier in May.
For this move, it can be seen that the most recent lower high was set on 9 May, at $118.7. Over the past couple of days, the price has managed to push past the lower high, which meant the market structure had flipped to bullish.
For the same move down, a set of Fibonacci retracement levels was drawn. And, it can be seen that the price flipped the 50% retracement level at $113.5 to support.
The rising OBV has been above 50 for the past ten days too. Ergo, a lower timeframe can be examined to enter long positions.
AAVE- 2 Hour Chart
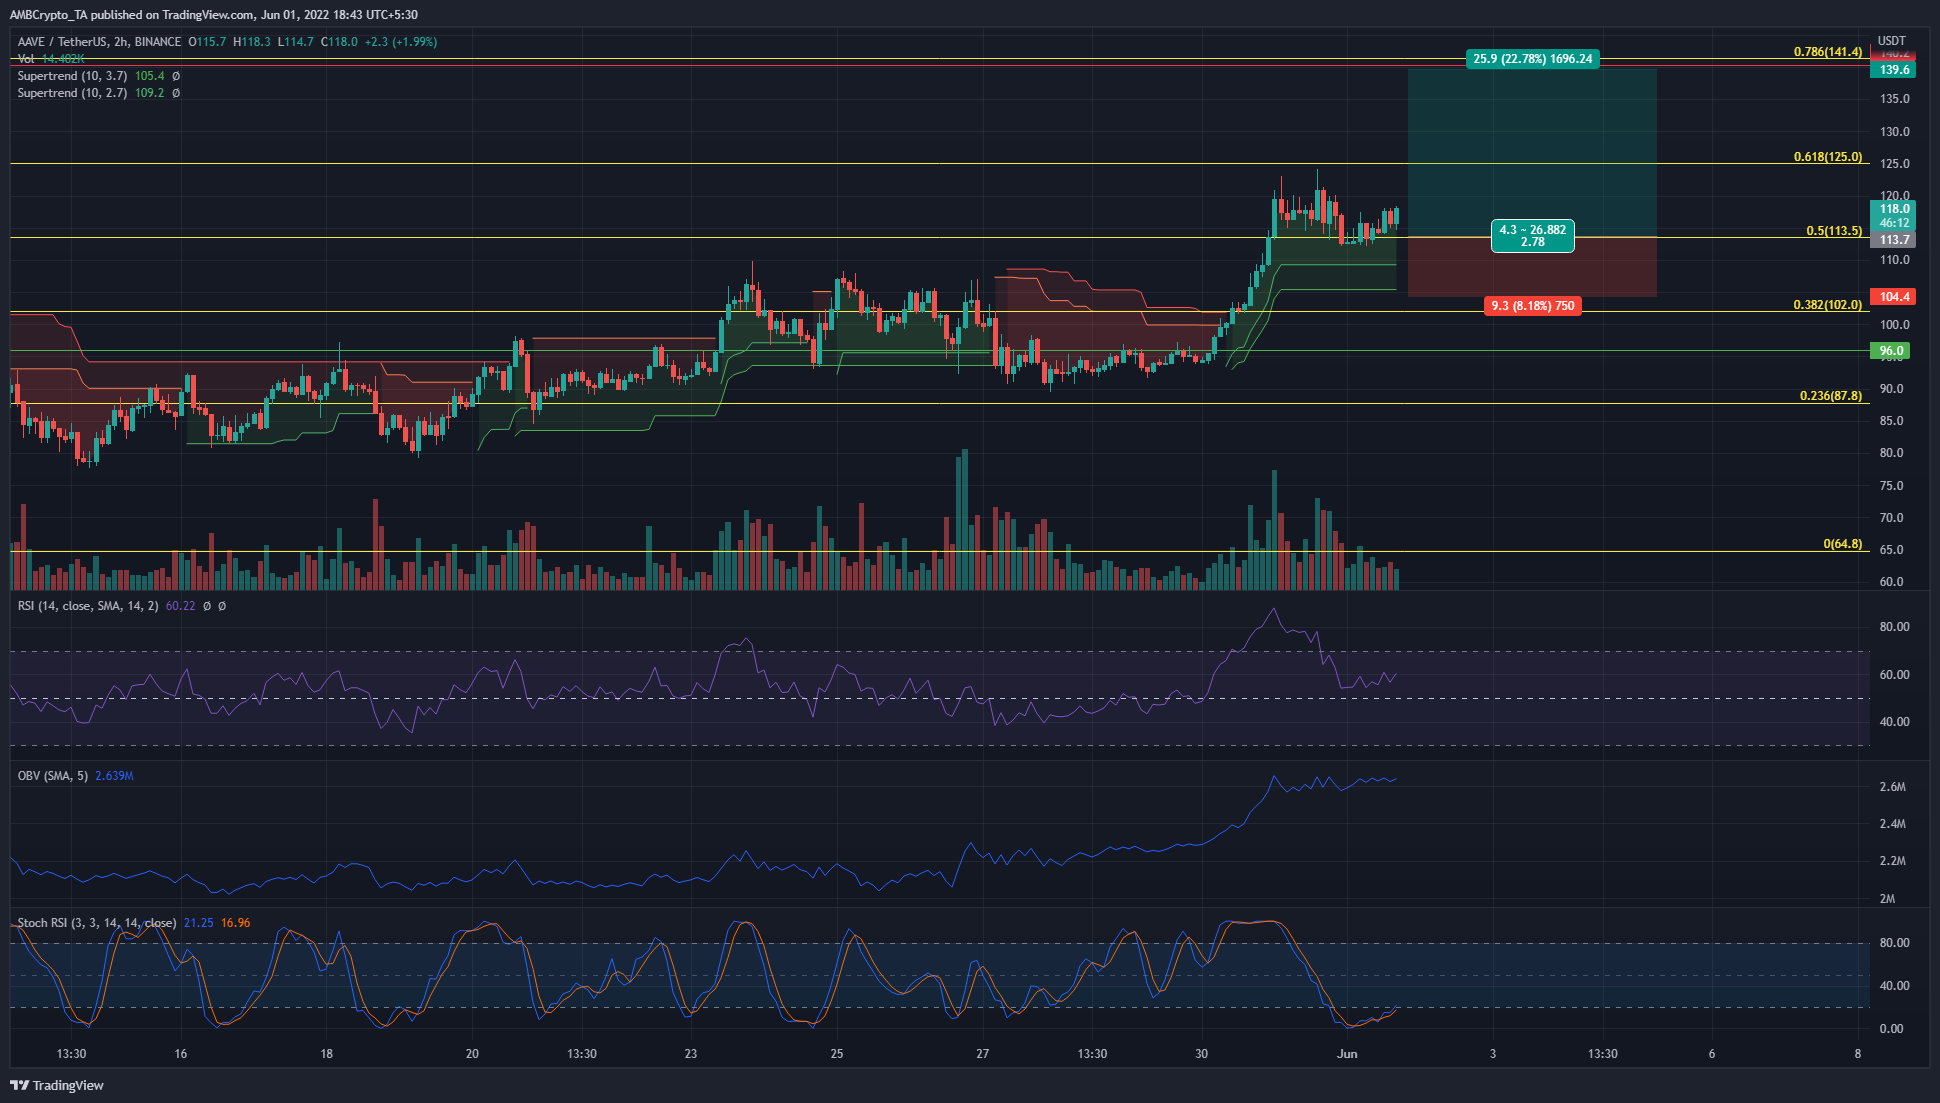
The H2 chart also projected a bullish bias as the price set higher lows and higher highs. On 30 May, the price saw a strong surge from $96 to $120. This broke past the two Supertrend indicators and flipped them to bullish. The RSI was also above 50, with the OBV climbing too. Therefore, the two indicators showed, respectively, bullish momentum and significant buying volume behind AAVE’s rally.
At the time of writing, the price had retested the $113-area as support. The Stochastic RSI was in the oversold territory and climbing upwards after forming a bullish crossover. Also, the two Supertrend indicators also flashed a buy signal. Therefore, a buy signal seemed to be in and a trader can look to enter a long position around the $113-$116 area with a stop-loss beneath the $104.4 level.
Conclusion
A move past the 38.2% retracement level generally means that the 61.8% to 78.6% retracement level can be seen. In this instance, the OBV has been climbing and the RSI also showed bullish momentum.
At the same time, Bitcoin also broke out of a range and looked set to move towards the $32k and $36k areas. This bullish impetus could embolden AAVE’s bulls as well. The Stochastic RSI crossover on the H2 chart, with a stop-loss under the two bullish supertrends, could be a profitable buy if AAVE can climb to $125 and $141.