The Sandbox [SAND] saw a bounce from $0.43, find out where short-sellers can enter
![The Sandbox [SAND] saw a bounce from $0.43, find out where short-sellers can enter](https://ambcrypto.com/wp-content/uploads/2022/12/PP-3-SAND-cover-e1671537783544.jpg)
Disclaimer: The information presented does not constitute financial, investment, trading, or other types of advice and is solely the writer’s opinion
- The trend was clearly in favor of the SAND bears.
- A revisit to the lower timeframe distribution from the past weekend can offer a shorting opportunity.
Since August, The Sandbox has faced a torrid time on the token’s price charts. Buyers have not seen respite from selling on the larger timeframe charts. Multiple significant support levels have been broken.
Read The Sandbox’s [SAND] Price Prediction 2023-24
Since 14 December, the Tether Dominance metric saw some gains as crypto market participants fled to stablecoins in the face of selling pressure. Bitcoin was unable to break out past its range, and would likely face resistance in the $17.6k-$17.8k area.
A bearish order block on the daily chart was spotted, bears can target Fibonacci extension levels
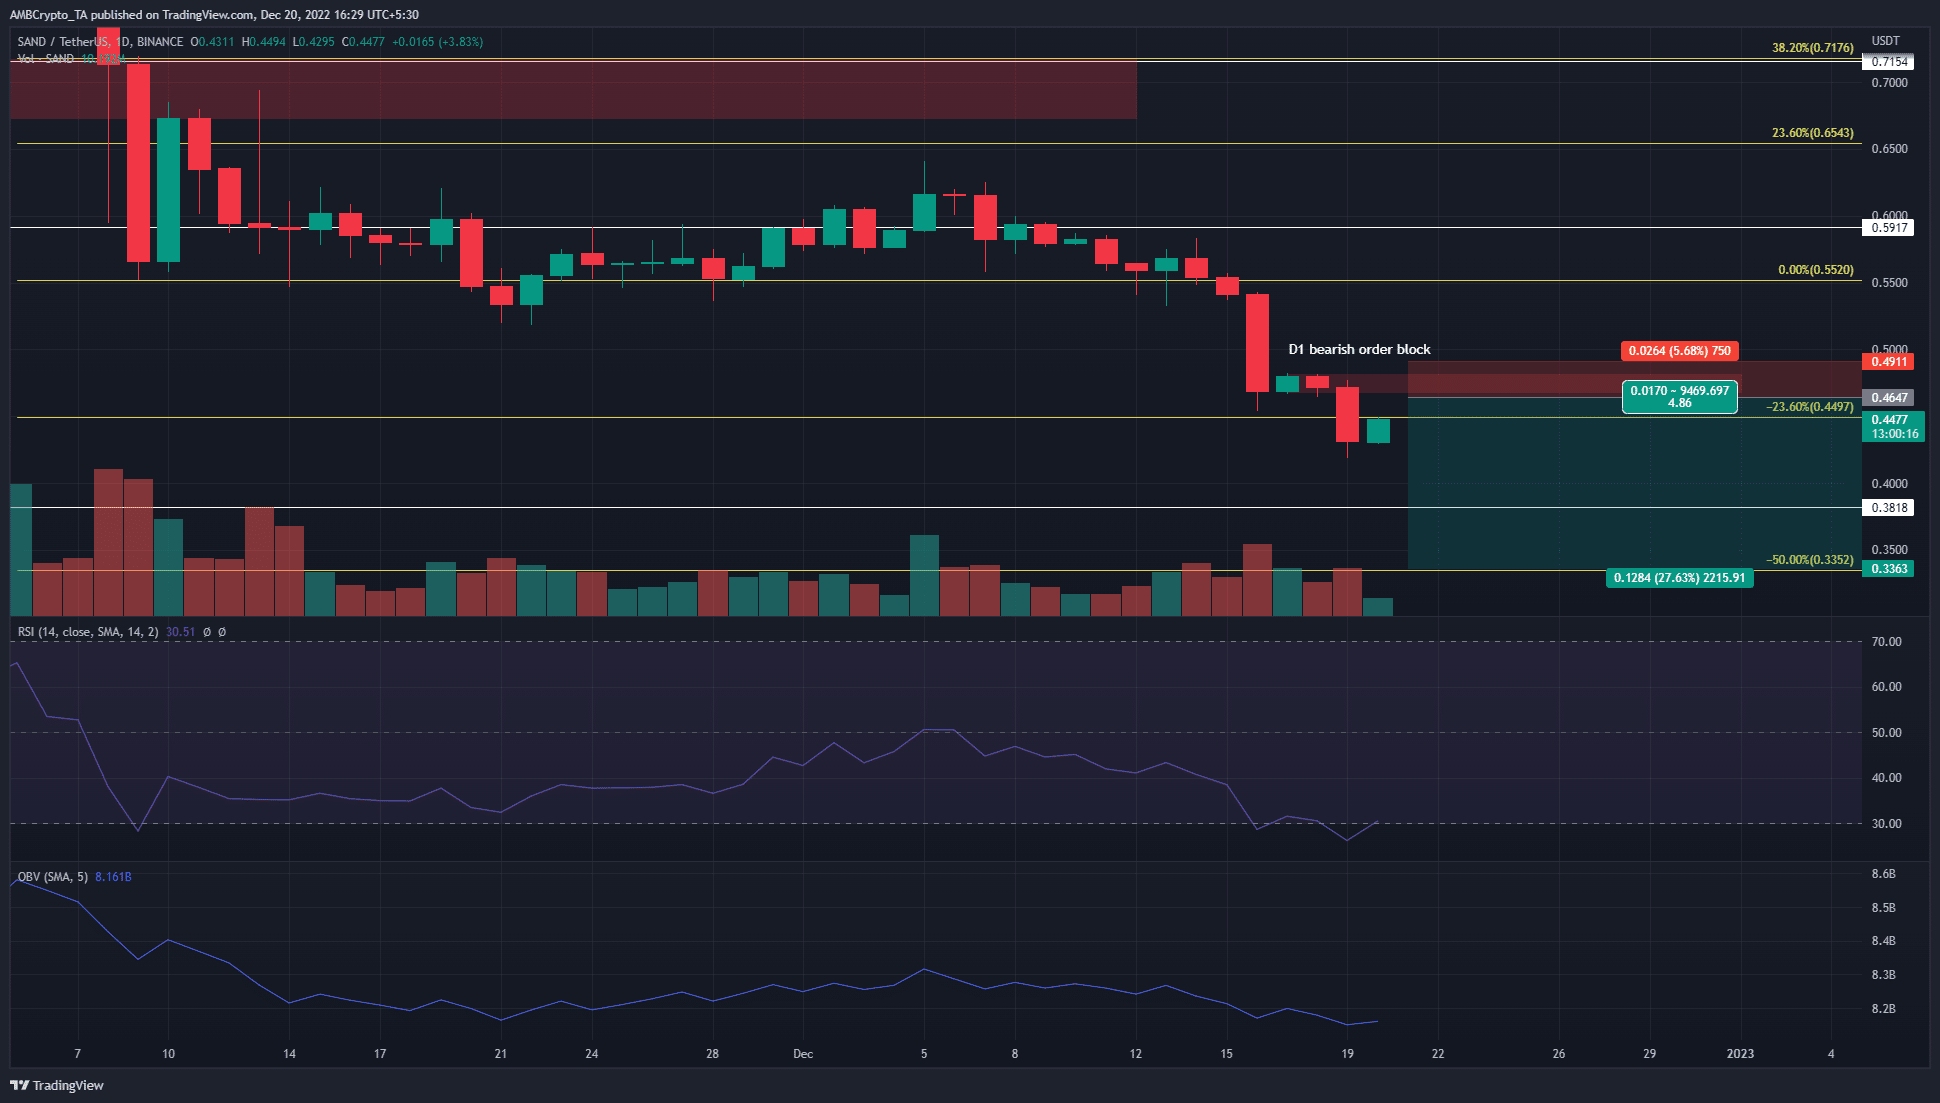
The early November crash saw the $0.715 region retested as resistance. Sellers were extremely strong in that zone and SAND continued its downtrend on the price charts.
On 5 December, The Sandbox broke out past a local resistance at $0.6, and pushed as high as $0.64. But instead of flipping the $0.6-$0.62 area to support it collected the liquidity at $0.64 and saw a quick bearish reversal.
On the daily timeframe, the RSI also indicated a strong downtrend in progress. During the move to $0.64 and the subsequent rejection, the RSI did not breach neutral 50. The OBV also retraced the gains it made in the first week of December.
Over the weekend, the token consolidated for some time in the $0.46-$0.48 area. It formed a bearish order block on the daily timeframe and highlighted a region where another sharp rejection could materialize. Fibonacci extension levels at $0.45 and $0.33 can also serve as resistance and support levels respectively in the next few weeks.
Mean coin age suffers a large dent but the funding rate climbed in recent hours
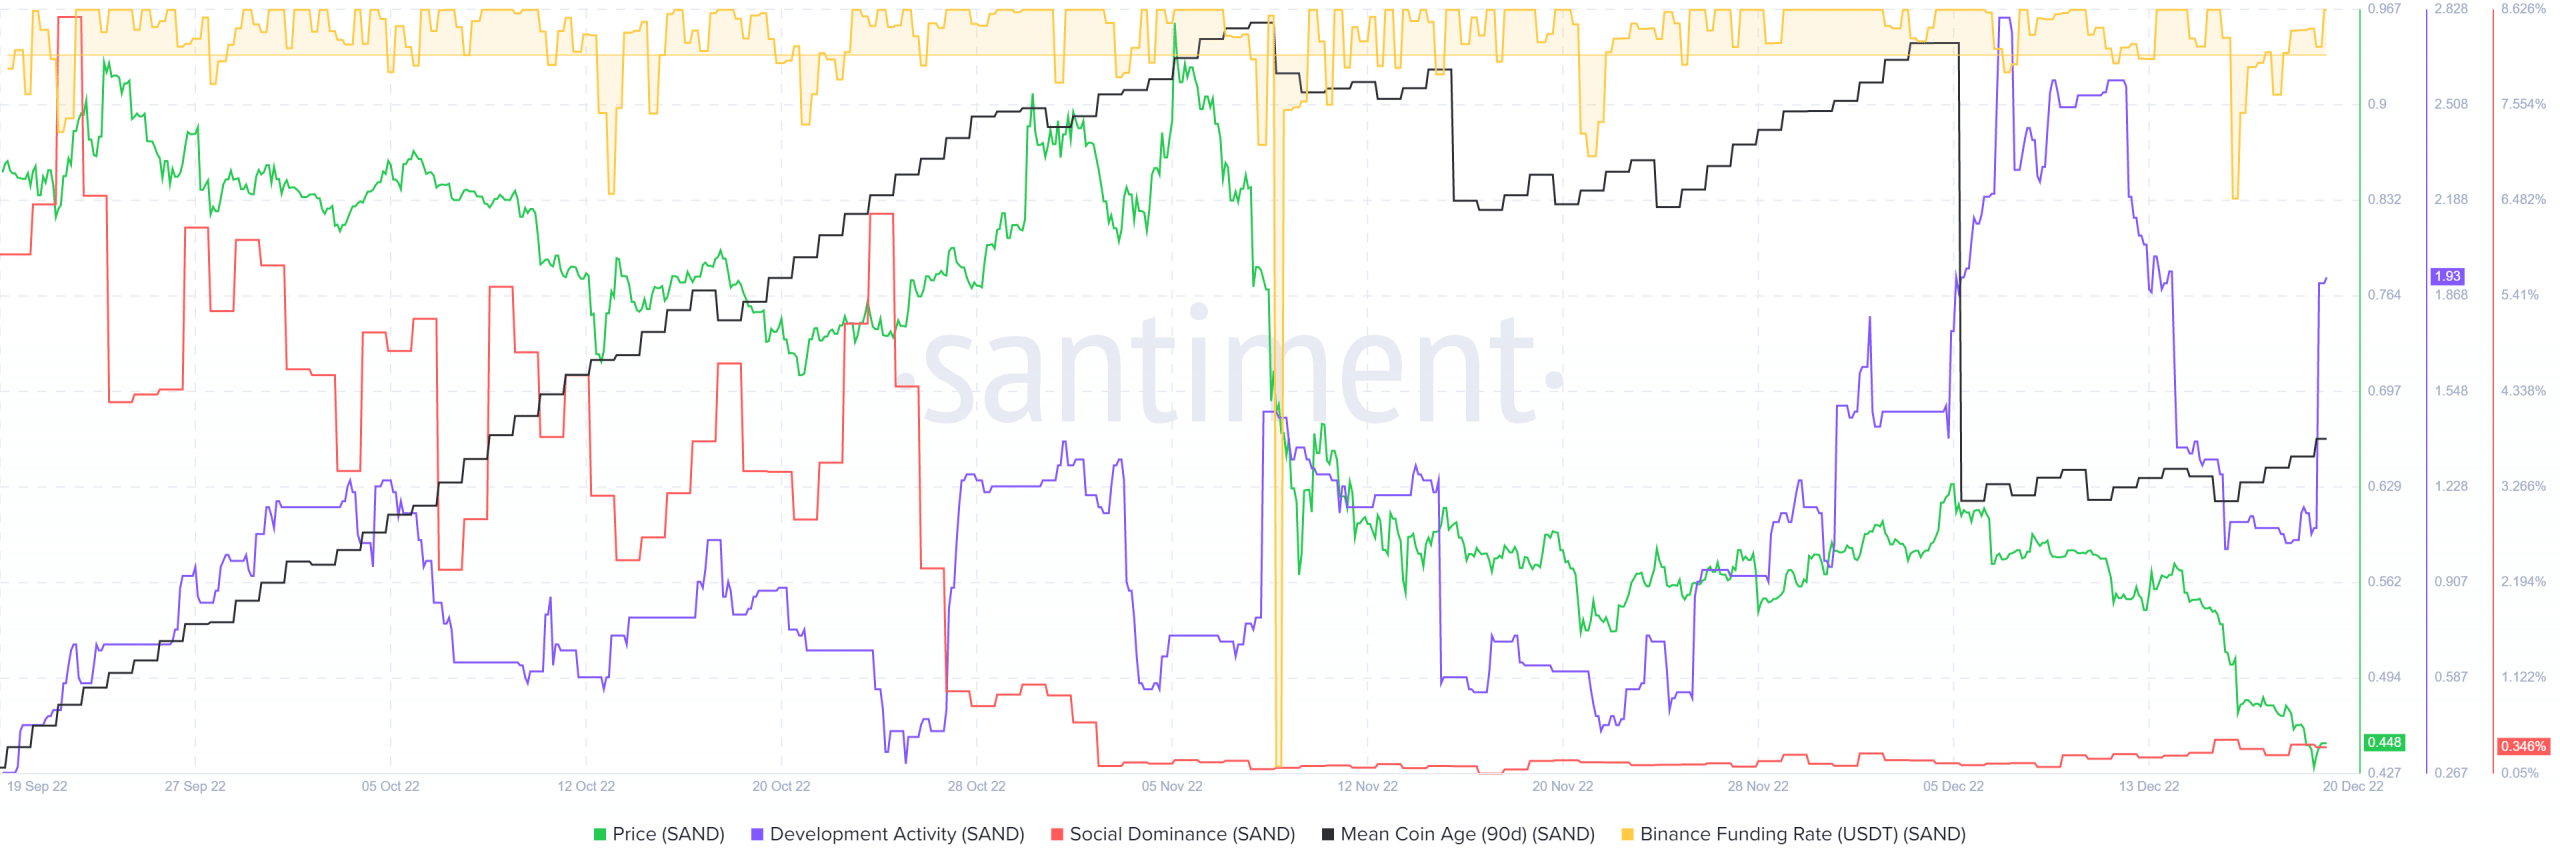
The 90-day mean coin age saw a sharp decline on December 6 to show the widespread movement of SAND tokens. This marked the local top for the asset at a price of $0.62 when the bears succeeded in reigning in bullish momentum.
Social dominance has been really low since November but has climbed by a small amount. More importantly, the development activity reached a three-month high in early December despite the selling pressure the price saw.
This can encourage long-term buyers. At press time, the funding rate was positive, but this could be due to the lower timeframe bounce from $0.43.


![Stellar [XLM] crypto price prediction 2030: What would it take to reach $1?](https://ambcrypto.com/wp-content/uploads/2026/07/Adewale-2-1-4-e1785263791517.webp)