These metrics must change their course to restrain Polkadot from falling off the edge

Polkadot, one of the market’s most prominent sharded multichain networks, was in the news recently owing to a report that linked its token outflows to the parachain auctions.
In the short timeframe, the asset’s price did not react negatively. In fact, after creating a low of $27.69 on 3 December, DOT managed to negate its losses.
Interestingly, even at the time of writing, DOT was the only asset in the top 10 that had witnessed an uptick in the 24-hour window.
Too good to last?
Well, DOT’s price is evidently at an indecisive juncture. At this point, there are quite a few question marks revolving around whether or not it would be able to capitalize on its recent change in narrative.
At the time of this analysis, DOT was seen revolving at $29, right below its 61.8% Fibonacci level. As evidenced from the chart below, the aforementioned Fib level has acted like quite a strong support for the coin throughout the September-October period. So, at this point, it remains critical for DOT to avoid dunking below $27.4.
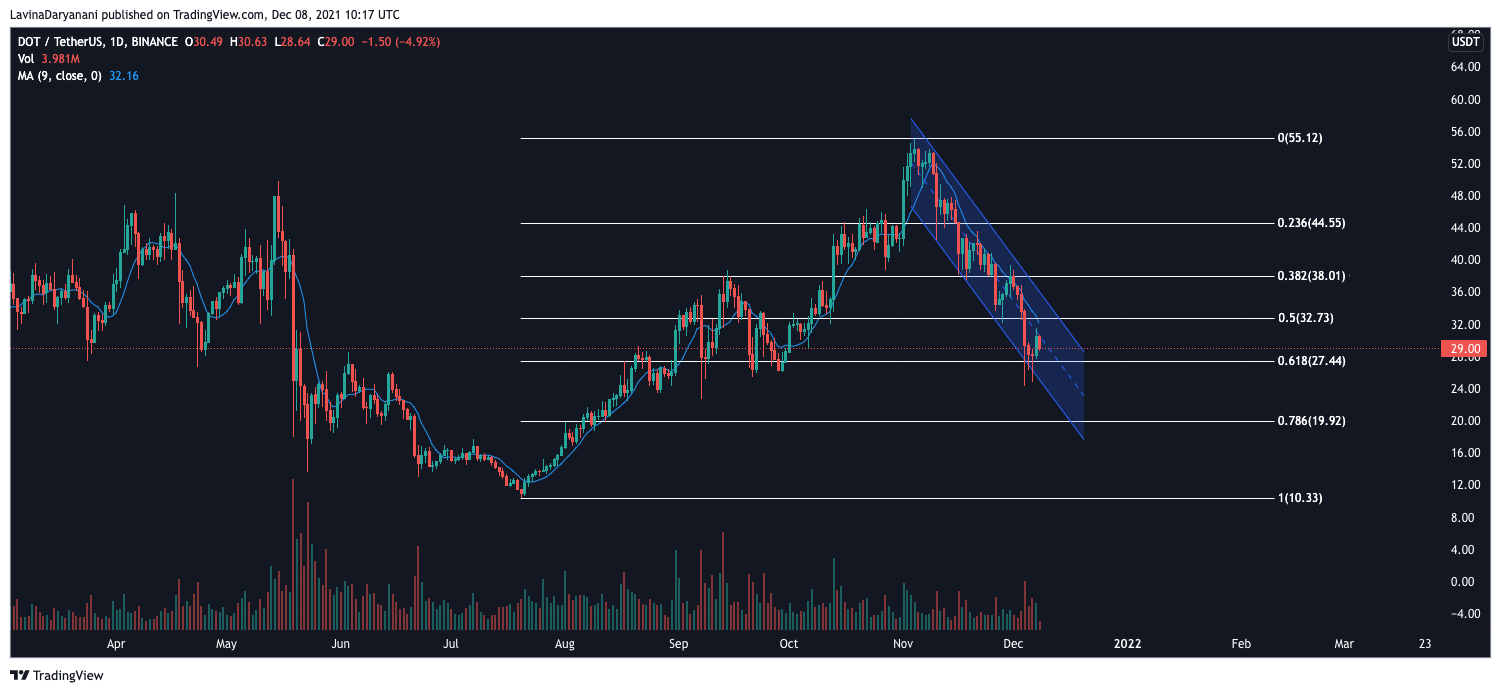
However, since the beginning of November, Polkadot has been trading under its moving average. The asset has shed close to 50% of its value since then. And, in retrospect, its price has been engulfed within a descending channel.
So, from this point on, if bears re-step into the picture and gain an upper hand, DOT’s price would decline. The next major support lies around the $78.6% Fib level, which means DOT’s dip could be as deep as 30%. Even so, the asset does have two other minor support levels [one around $24 and the other around $22] right beneath its current price.
Thus, it is interesting to see if these levels could save the day for DOT or not.
Metrics weave a bearish outlook
The state of Polkadot’s metrics gave credence to the downtrend narrative. For instance, the average transfer value between addresses has been more towards the downside over the last couple of days.
Whenever this metric has peaked, DOT’s price has more often than not made a local high within the next couple of days. The same was witnessed earlier in May, September, and November this year.
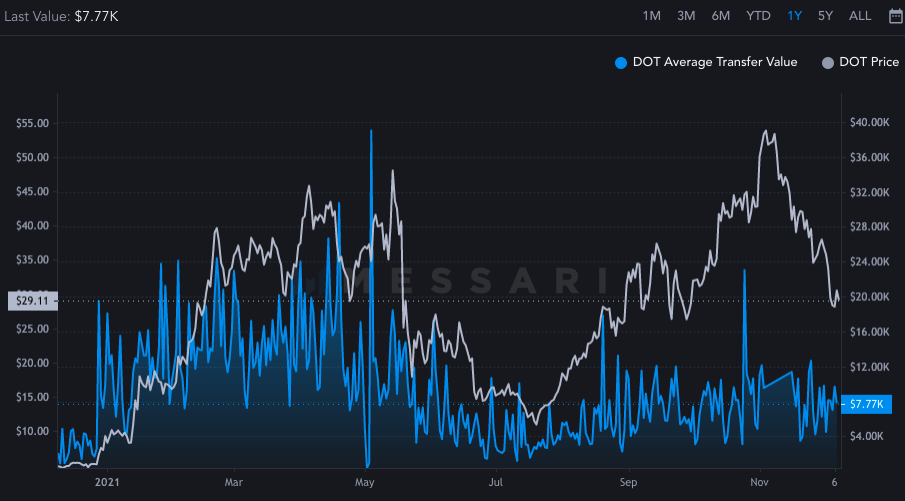
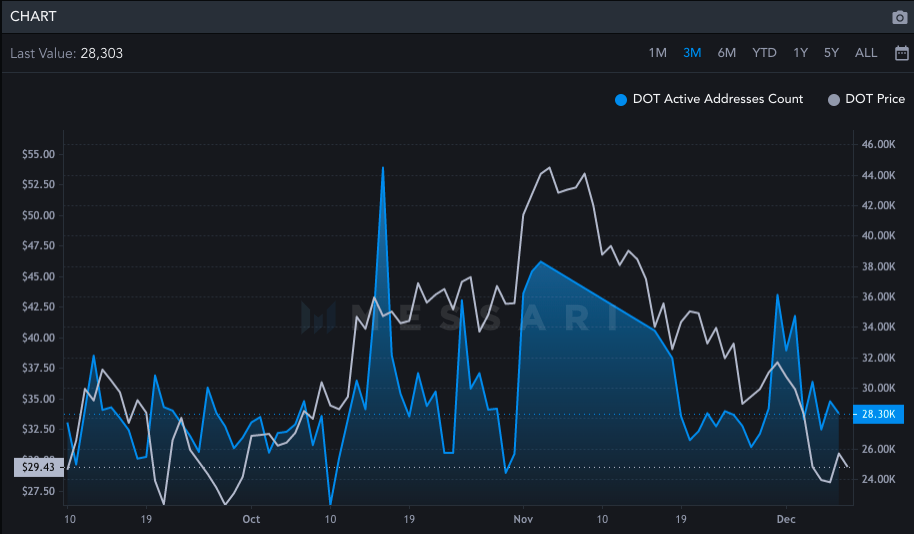
The drop in the average count comes as no surprise because the number of active addresses has been more towards the downside when compared to its November highs. So, it is quite essential for both the aforementioned metrics to change their course to aid the alt’s price recovery.
However, keeping their current projections in mind, it looks like DOT would end up shedding value over the next couple of days. If the support levels aid the alt, then losses would be limited. But if they pull the plug, then DOT might end up losing close to one-third of its value.


