This is the key to convincing investors of AVAX’s uptrend

Disclaimer: The findings of the following analysis are the sole opinions of the writer and should not be considered investment advice
Avalanche, the fourth-biggest DeFi chain in the crypto-sector, has had an uninspiring social presence. This, even though its active user base has grown steadily in recent months. Could this fact have an impact on its price?
Well, on the charts, AVAX hinted at a possible minor pullback.
AVAX- 12 hour chart
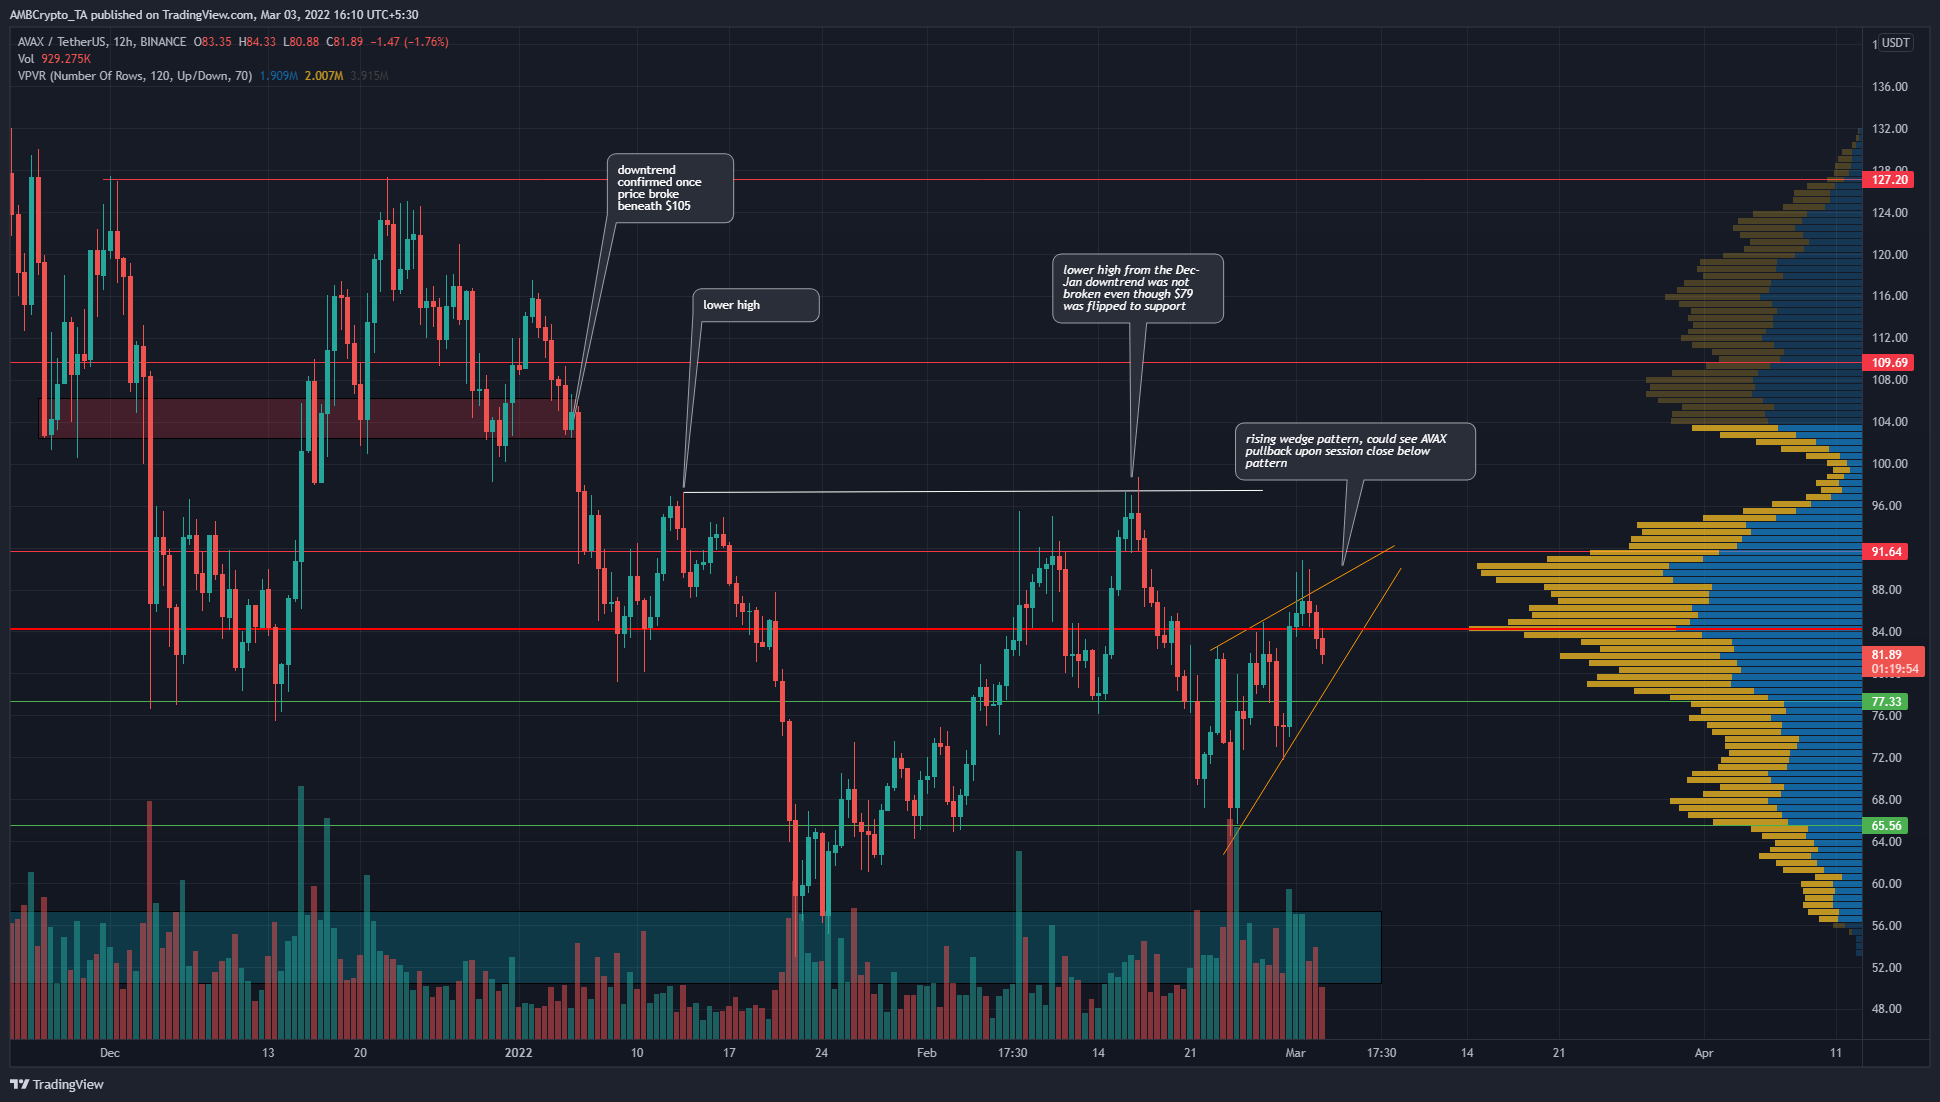
On the charts, the crypto’s price has been on a downtrend since late December. In mid-February, at the end of a short-term rally from its $56-lows, it looked like the bulls could flip the bias on the longer-term outlook as well. This was because $97 marked the previous lower high and a break of this level would have suggested rising bullishness behind AVAX.
The price did see a candlewick above $97 but not a session close in mid-February. Since then, the price has dropped back to the $65-level to find support and has advanced once again. The bounce from the $65-level can be considered as the formation of a higher low after the lows at $56 were reached in late January.
At the time of writing, AVAX formed a rising wedge pattern (orange), a pattern that generally sees the price drop lower. To the south, $77 and $65 area are long-term support levels.
The VPVR showed that the Point of Control lay at $84.5 and the price was unable to climb past this resistance. To the south, the VPVR showed support could be seen till the $77-$78 area, with the $65-area being the next significant volume node.
Rationale
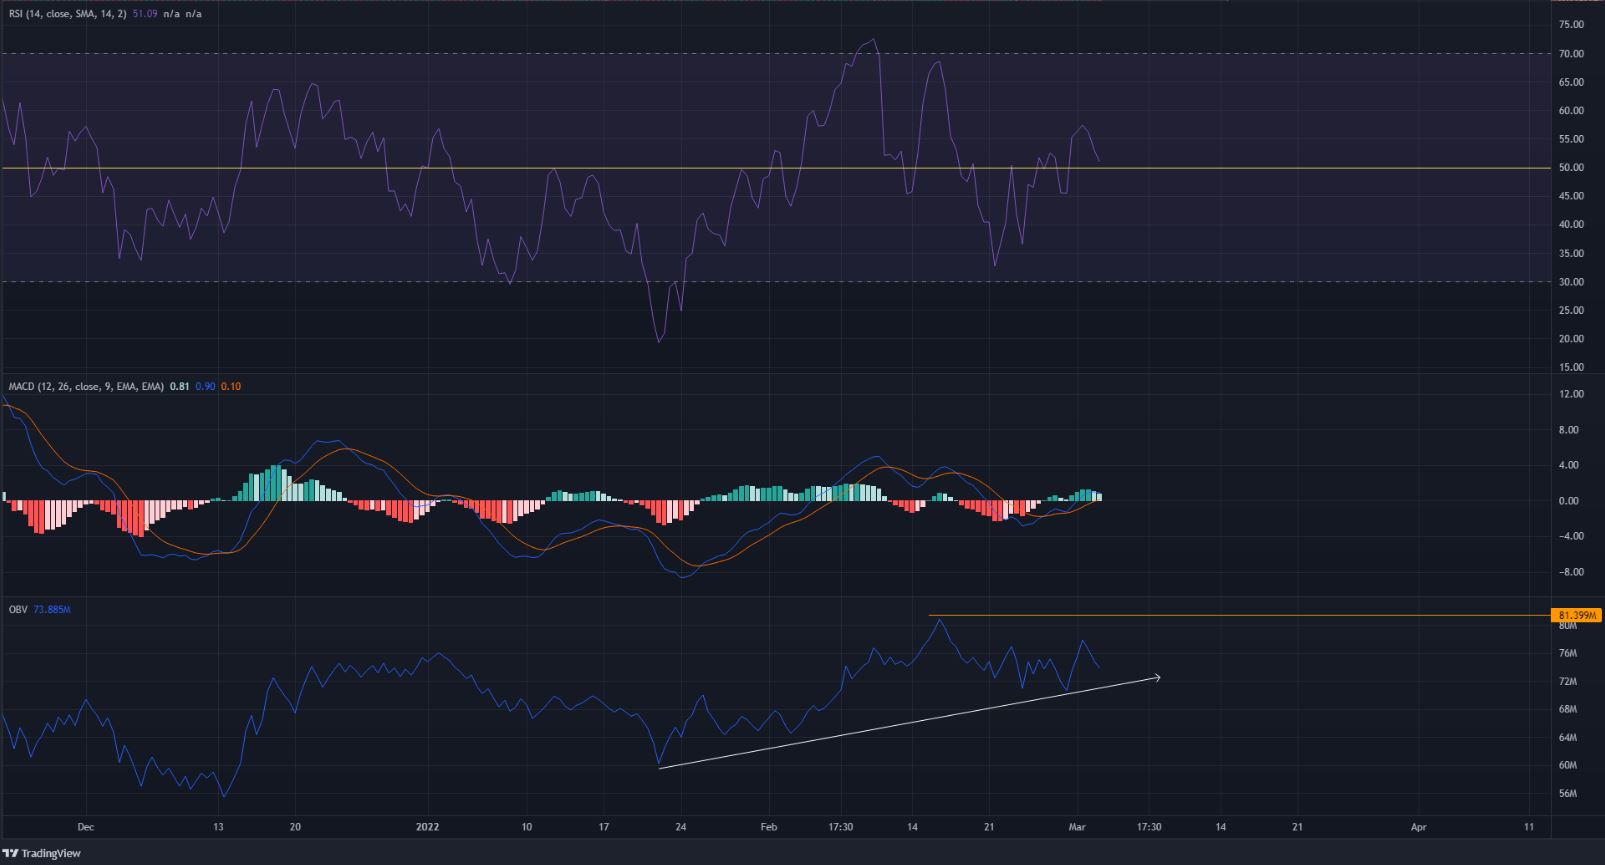
The RSI climbed above neutral 50 in response to its recent gains. However, it did not signal strong momentum was behind AVAX in either direction at press time. It was a similar story with the MACD, which was at the zero line and trying to climb above it.
The momentum indicators showed that there wasn’t a trend or strong momentum that pointed in one direction for Avalanche. The OBV, on the other hand, was encouraging to the bulls. It has formed higher lows since mid-December and late January. This underlined that steady buying was present behind the asset despite strong drops in price.
Conclusion
The evidence on the OBV suggested that Avalanche could be on its way to making gains in the weeks to come. Alas, the market structure has not yet flipped to bullish. The rising wedge pattern could see AVAX pullback to $77-$72 before its next leg upward.
$97 would have to be broken and flipped to support before longer-term investors can be convinced they can ride an uptrend.


