Traders should expect this from Bitcoin Cash’s near-term price action

Disclaimer: The findings of the following analysis are the sole opinions of the writer and should not be taken as investment advice
Bitcoin Cash has grown from strength to strength over the last few days. The emergence of an ascending channel highlighted a strong uptrend as the alt toppled some important price ceilings. At the time of writing, BCH was challenging the all-important 38.2% Fibonacci level. Alas, a slight retracement can be expected before a breakout.
This largely stemmed from overbought readings on the RSI and a bearish 4-hour 200-SMA (green) which posed as resistance.
Bitcoin Cash 4-hour Chart
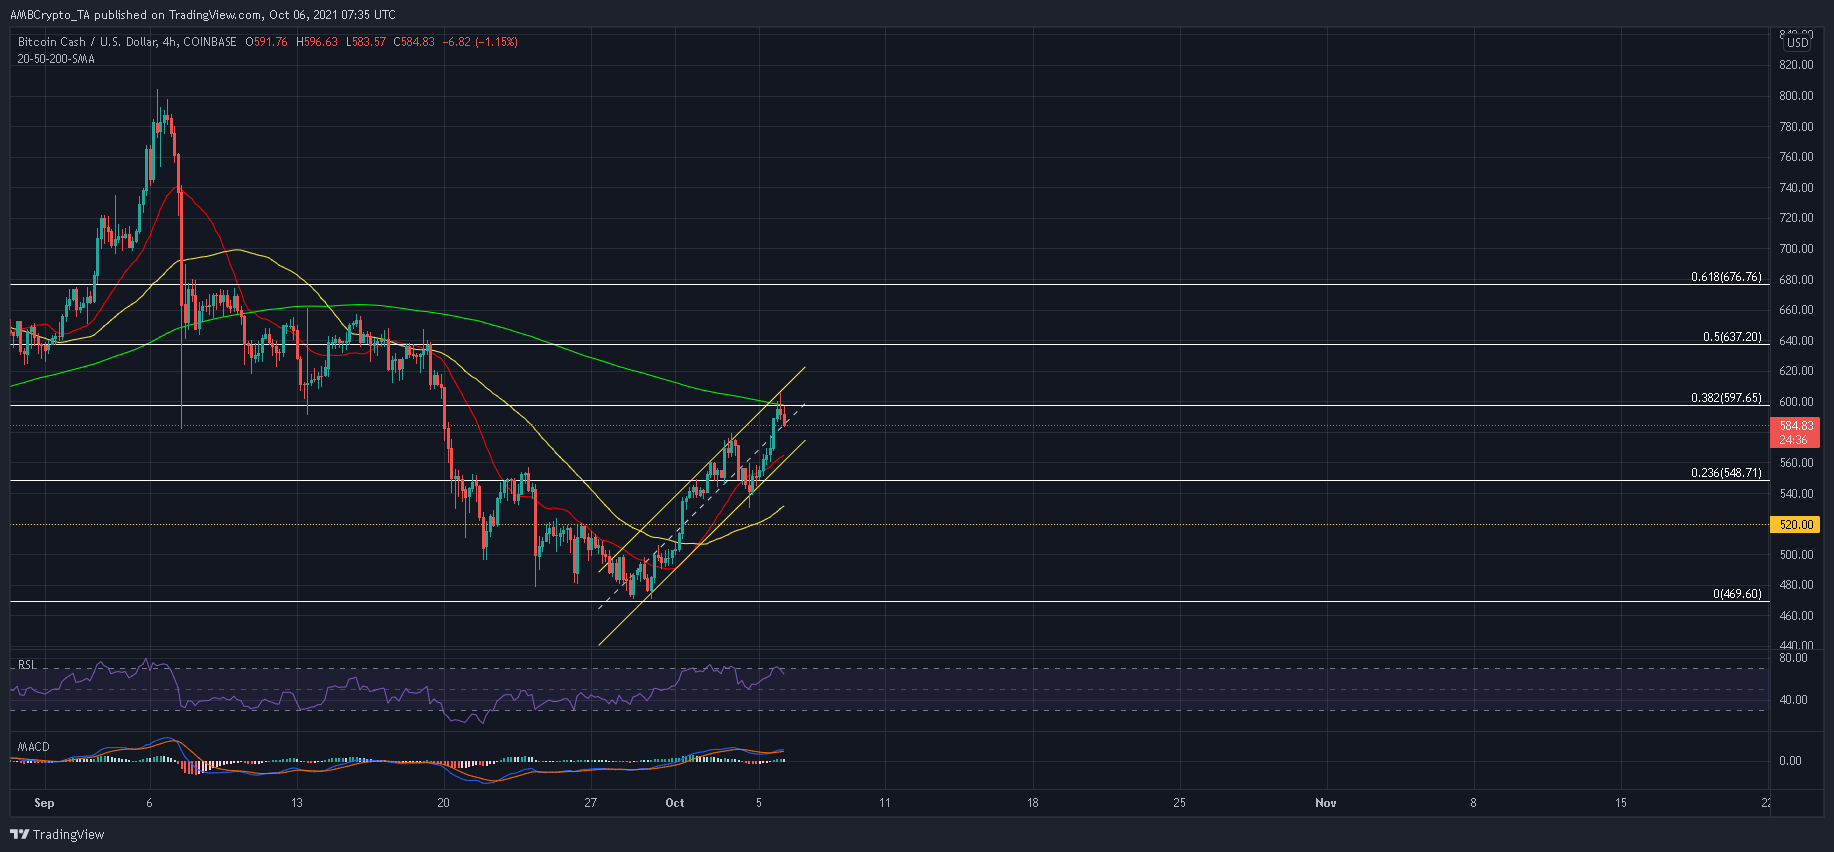
The last 7 days saw BCH climb by 33% as the price rebounded from 23rd May’s swing low of $470 and embarked on a strong upwards run. This allowed BCH to challenge the coveted 38.2% Fibonacci level. While functioning as a support, the aforementioned level has had 4 points of contact – 12 August, 25 August, 7 September and 13 September.
Now flipped to resistance, the region could be a tough nut to crack. Especially since it also clashed with the 4-hour 200-SMA (green). Failing to close above this region would enable a slight retracement as investors book some profits. A move towards the bottom trendline of the pattern and the 20-SMA (red) can also be expected if BCH slips below $585.
However, expect buyers to punch back immediately with a breakout attempt of their own.
On the other hand, a close below the 23.6% Fibonacci level would see a breakout in the opposite direction. From there, sellers can target a retest of the $520-support.
Reasoning
The RSI’s overbought nature called for a healthy correction before the next upcycle. Since BCH was within an uptrend, it seemed crucial for the RSI to maintain a position above 50 in order to fuel the next leg upwards.
Meanwhile, the MACD was at the helm of a bearish crossover as buying pressure eased. This reading could invite a few more sellers to the market.
Conclusion
The confluence of the 4-hour 200-SMA (green) and the 38.2% Fibonacci level presented major hurdles with respect to BCH’s near-term trajectory.
Combined with an overbought RSI and an indecisive MACD, BCH could move south before going past the $600-mark. In case of an early bullish breakout, the next challenge lay at the 50% Fibonacci level.


