TRON in a healthy uptrend despite fear in the market, should traders look to buy

Disclaimer: The information presented does not constitute financial, investment, trading, or other types of advice and is solely the writer’s opinion
- TRON has a bullish market structure on the 12-hour timeframe
- TRX bulls have recovered from the losses the asset posted last week
TRON tested the $0.053 level of support multiple times in December. The technical indicators showed a bullish momentum and strong demand behind the asset. On the other hand, Bitcoin [BTC] faced selling pressure near the $17.3k area.
Are your TRX holdings flashing green? Check the Profit Calculator
TRON tweeted recently that they ranked second in terms of Total Value Locked (TVL), only behind Ethereum. It also has a promising burn rate which showed more green days could be in store.
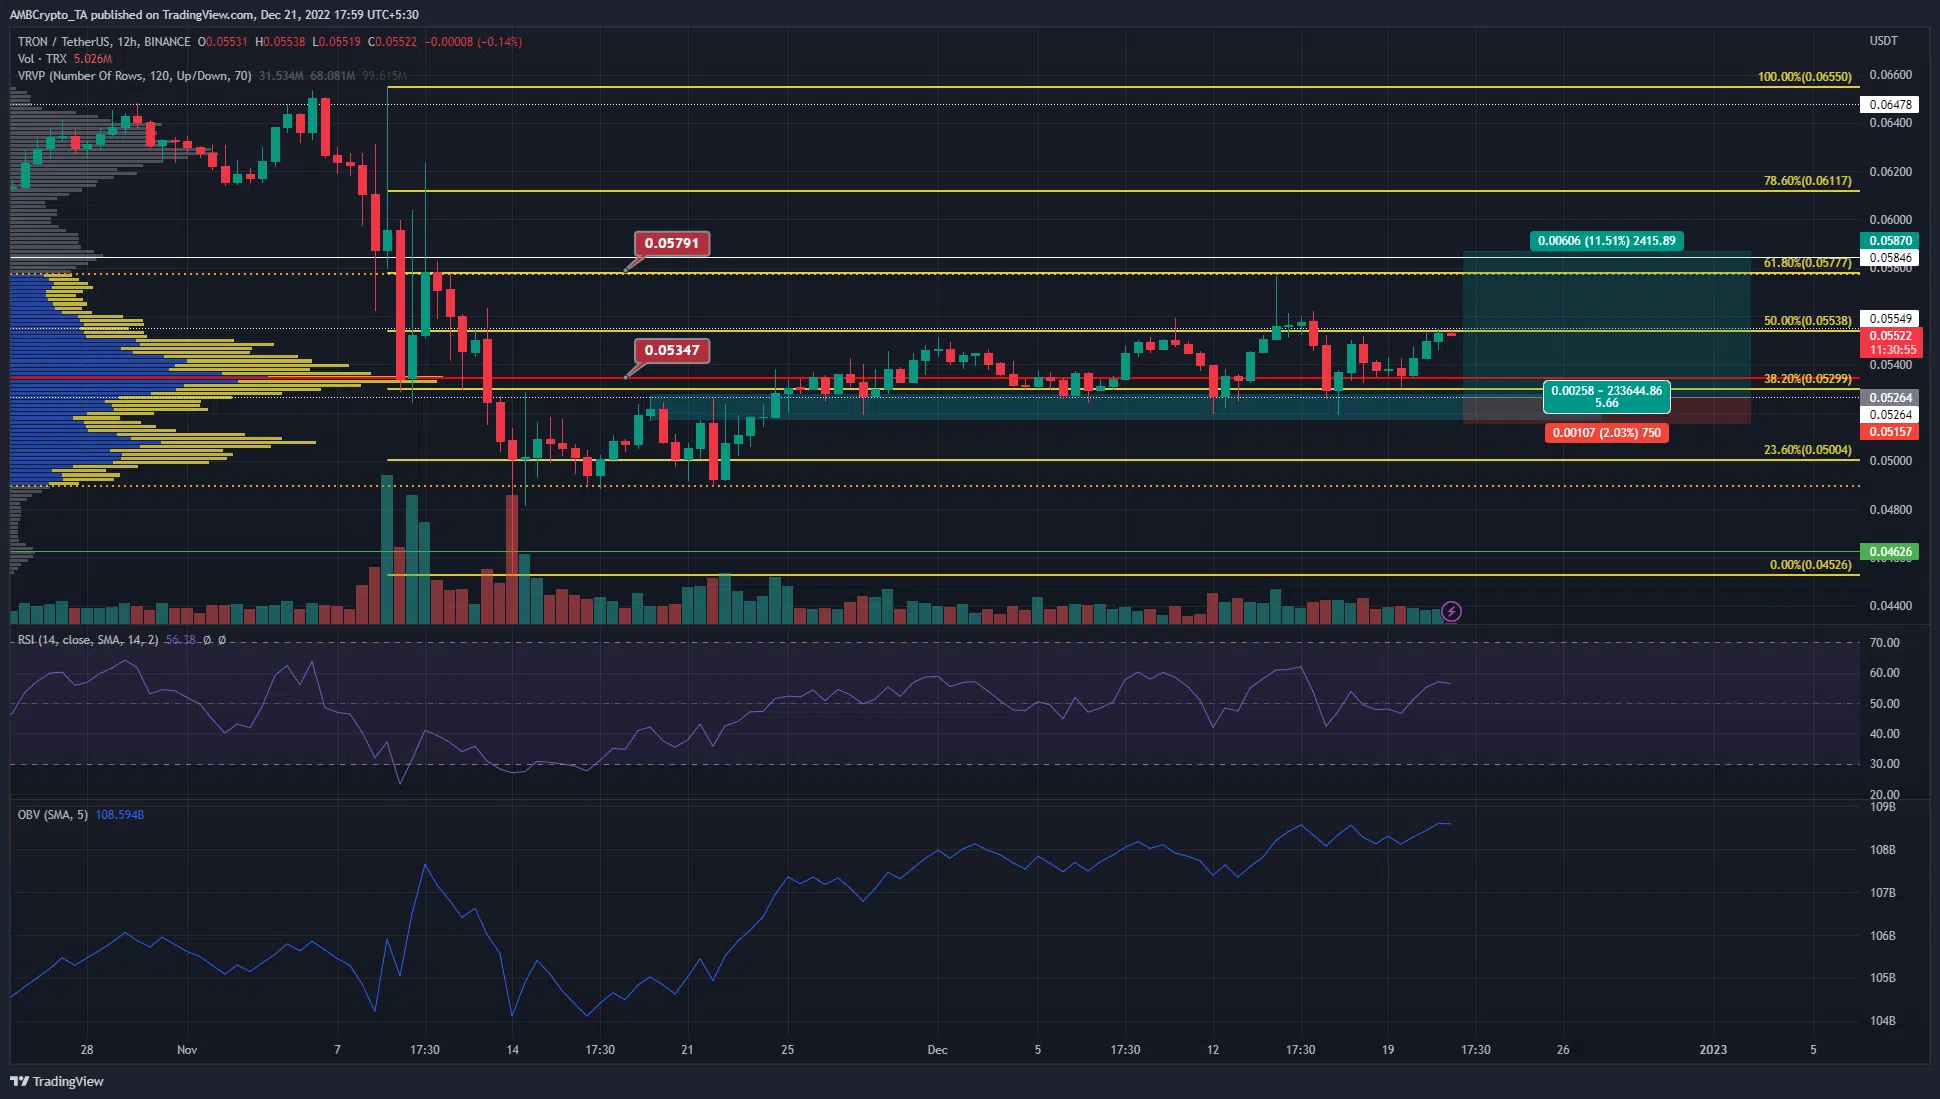
Bullish breaker has been defended so far and has confluence with Point of Control
The Visible Range Volume Profile tool highlighted the two contextually most important levels for TRON going forward. The first was the Point of Control (red) at $0.053, and the other was the Value Area High (orange dotted) at $0.058.
At press time, the price was at the 50% retracement level of $0.0577. These Fibonacci retracement levels (yellow) were plotted based on TRX’s move down from $0.065 to $0.045.
On 26 November, TRX retested the $0.0526 level as support. Beneath this level was a bullish breaker that extended from $0.0527 to $0.0516. Since late November the price has tested this bullish breaker multiple times and has seen a positive reaction on each retest.
In recent weeks TRON has set higher highs on the price charts and had a bullish structure at the time of writing. These higher lows and retests of the bullish breaker formed a broadening ascending right-angled pattern as well. The pattern has a likelihood of witnessing a northward breakout for the price.
With Bitcoin facing some selling pressure in the vicinity of $17k-$17.3k, a pullback could offer bulls a chance to buy TRX. The RSI was above neutral 50 and showed some bullish momentum. Meanwhile, the OBV has been rising rapidly since late November to indicate strong buying pressure.
Flat Open Interest alongside rising prices did not bode well for the bulls

Source: Coinalyze
Although the ascending right-angled pattern generally sees an upward breakout, the flat open interest chart suggested the prices may already have reached their local top. A lack of rise in OI despite a trend in a certain direction showed weakness in the trend.
How many TRXs can you get for $1?
The liquidations chart showed a large number of long positions sniped on 16 December. Since then there were not many significant long liquidations, although some amounts of short positions did get taken out in lower timeframe surges.


