TRON, MATIC, Compound Price Analysis: 04 September

Bitcoin’s price action has remained choppy around the 50k level over the past week. Certain altcoins, however, did not immediately reflect an uptrend. TRX fell by 2.5% and inched closer to its support line of $0.958, Compound also declined by 2.3% and prepared to fall to $393.07. Finally, MATIC flashed consolidation while logging in gains of 1.2%.
TRON [TRX]

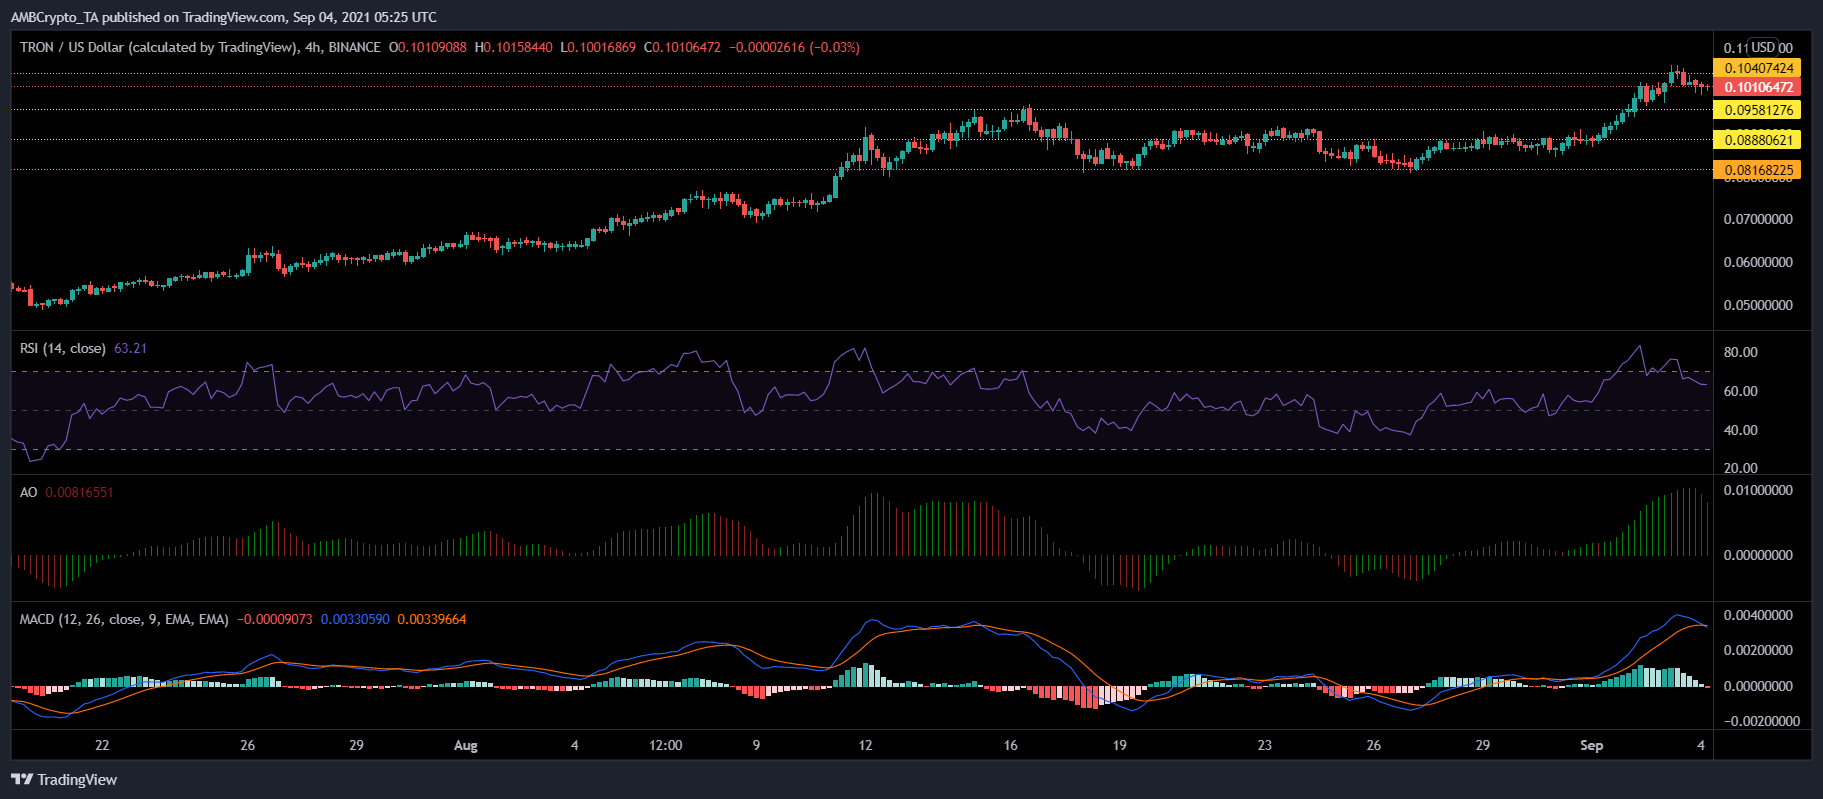
TRX/USD, TradingView
TRX slipped down on its charts by 2.5% over the last 24 hours and was trading at $0.101, at press time. The altcoin had registered a multi-month high yesterday, however, it failed to topple the $0.104 resistance. Its immediate support zone lay at $0.958, the additional support lines stood at $0.088 and at $0.816. TRX last traded around $0.816 almost three weeks ago.
Buying pressure fell near the 60-mark on the Relative Strength Index after the asset was overbought over the last 48 hours. Awesome Oscillator registered red signal bars. MACD’s green histogram receded and a red histogram was visible.
If TRX moves north again, it might retest the $0.104 and then the $0.108 price resistance levels.
MATIC

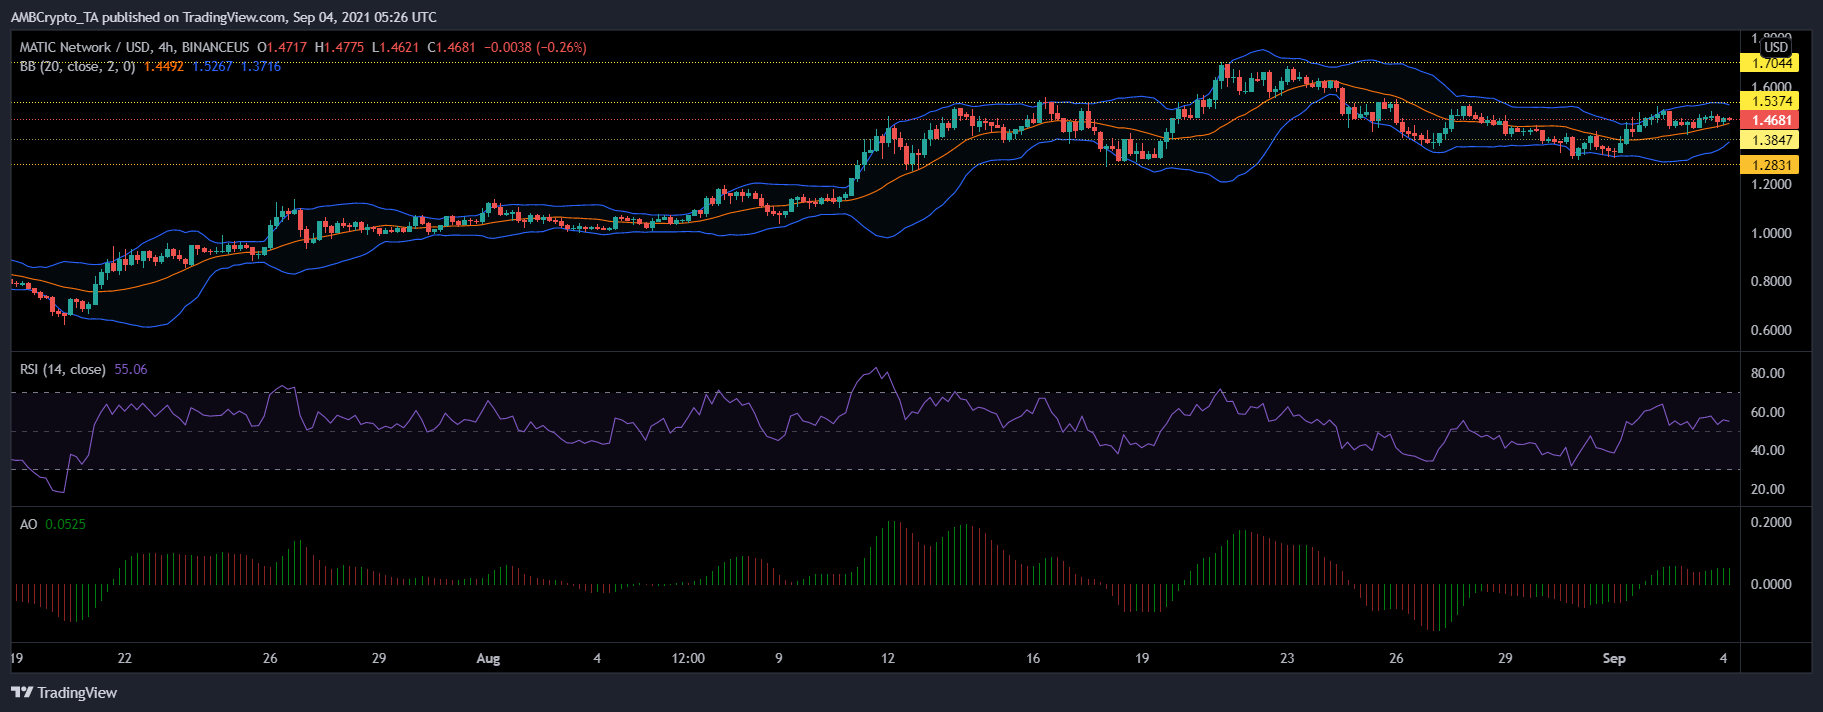
MATIC/USD, TradingView
MATIC pictured consolidation and was priced at $1.46 after registering a 1.2% hike over the previous day. At its press time price level, MATIC stood few notches below its weekly high. The immediate support level for MATIC was at $1.38 and then at $1.28. MATIC hasn’t traded below the $1.28 level in almost three weeks.
Technicals were positive, at the time of writing. Buying pressure noted an uptick and the Relative Strength Index stood above the mid-line. Awesome Oscillator flashed green signal bars. Bollinger Bands were converging somewhat and noted low volatility.
In the event of MATIC breaking its rangebound movement on the upside, it might revisit its weekly high of $1.53. Then, it might attempt to topple its three-month high of $1.70.
In a recent update, Coinbase decided to integrate Polygon’s scaling solution. This could have an impact on MATIC’s price going forward.
Compound [COMP]

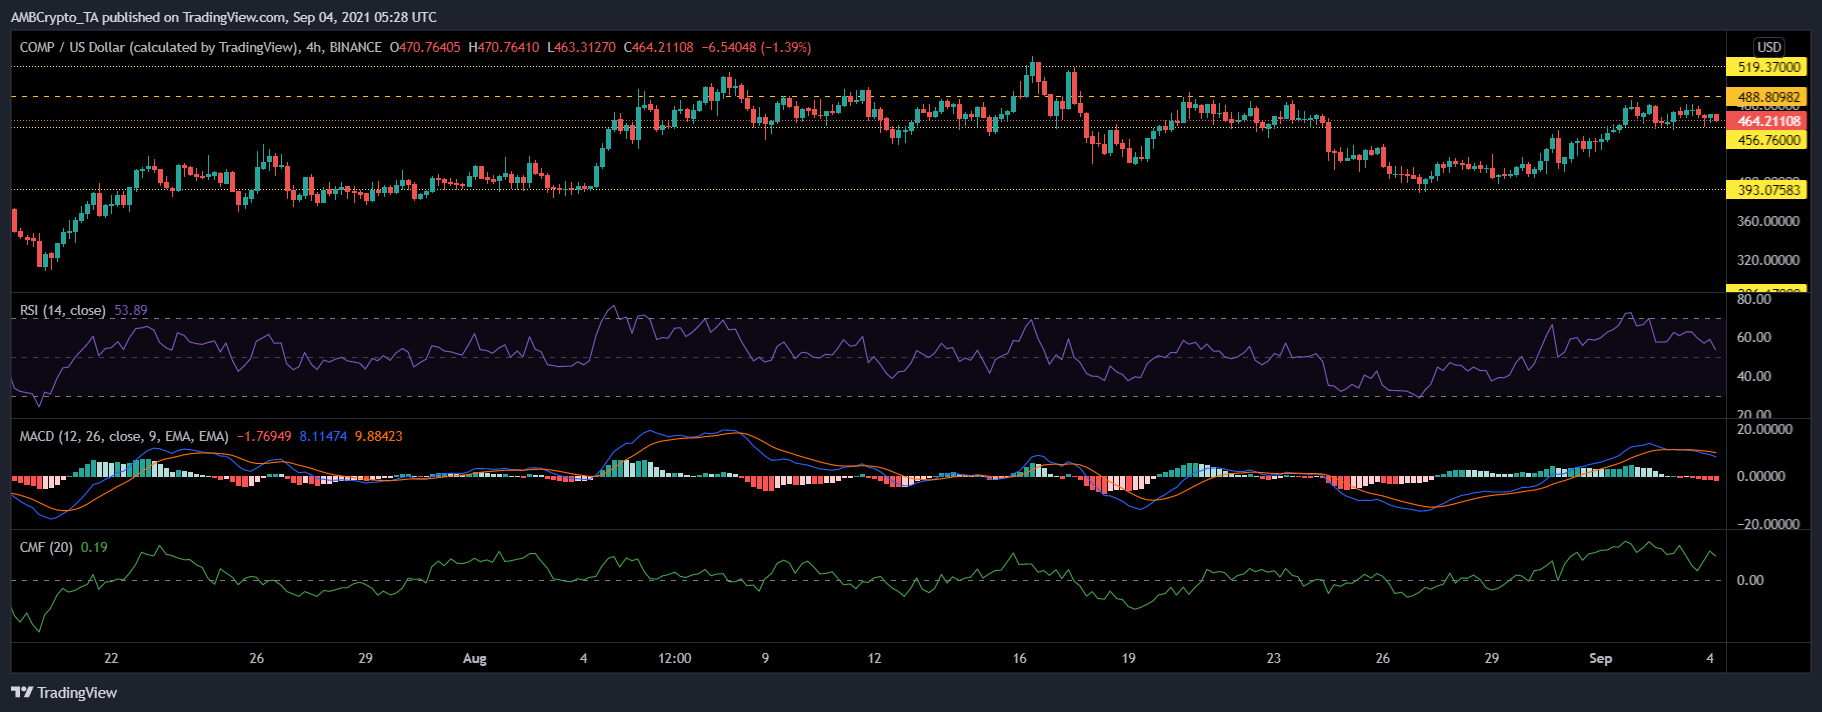
COMP/USD, TradingView
COMP declined by 2.3% over the last 24 hours and was trading at $462.21. It traded close to the immediate support price line of $456.76. The last time COMP was close to the $456.76 price line, it fell through and traded near the support zone of $393.07.
Relative Strength Index was inside the bullish territory, above the 50-mark. However, it threatened to fall below it. The MACD flashed red histograms which signified a price drop. Conversely, capital inflows remained high as the Chaikin Money Flow was well above the half-line.
A price reversal could push COMP to challenge its weekly high of $488.80 and then retest the multi-month high of $519.37.


