Tron, MATIC, WAVES Price Analysis: 07 September

Following Bitcoin and Ethereum’s consolidation over the last 24 hours, certain altcoins have either declined in value or displayed sideways price action. Although prices of Tron remained right below the multi-month high, the alt struggled to break over the $0.103 mark.
WAVES also showed signs of consolidation, however, technical indicators pointed that it could move near its immediate support of $27.05 over the upcoming trading sessions. MATIC lost 3.8% and it could trade near its one week low of $1.42.
Tron (TRX)
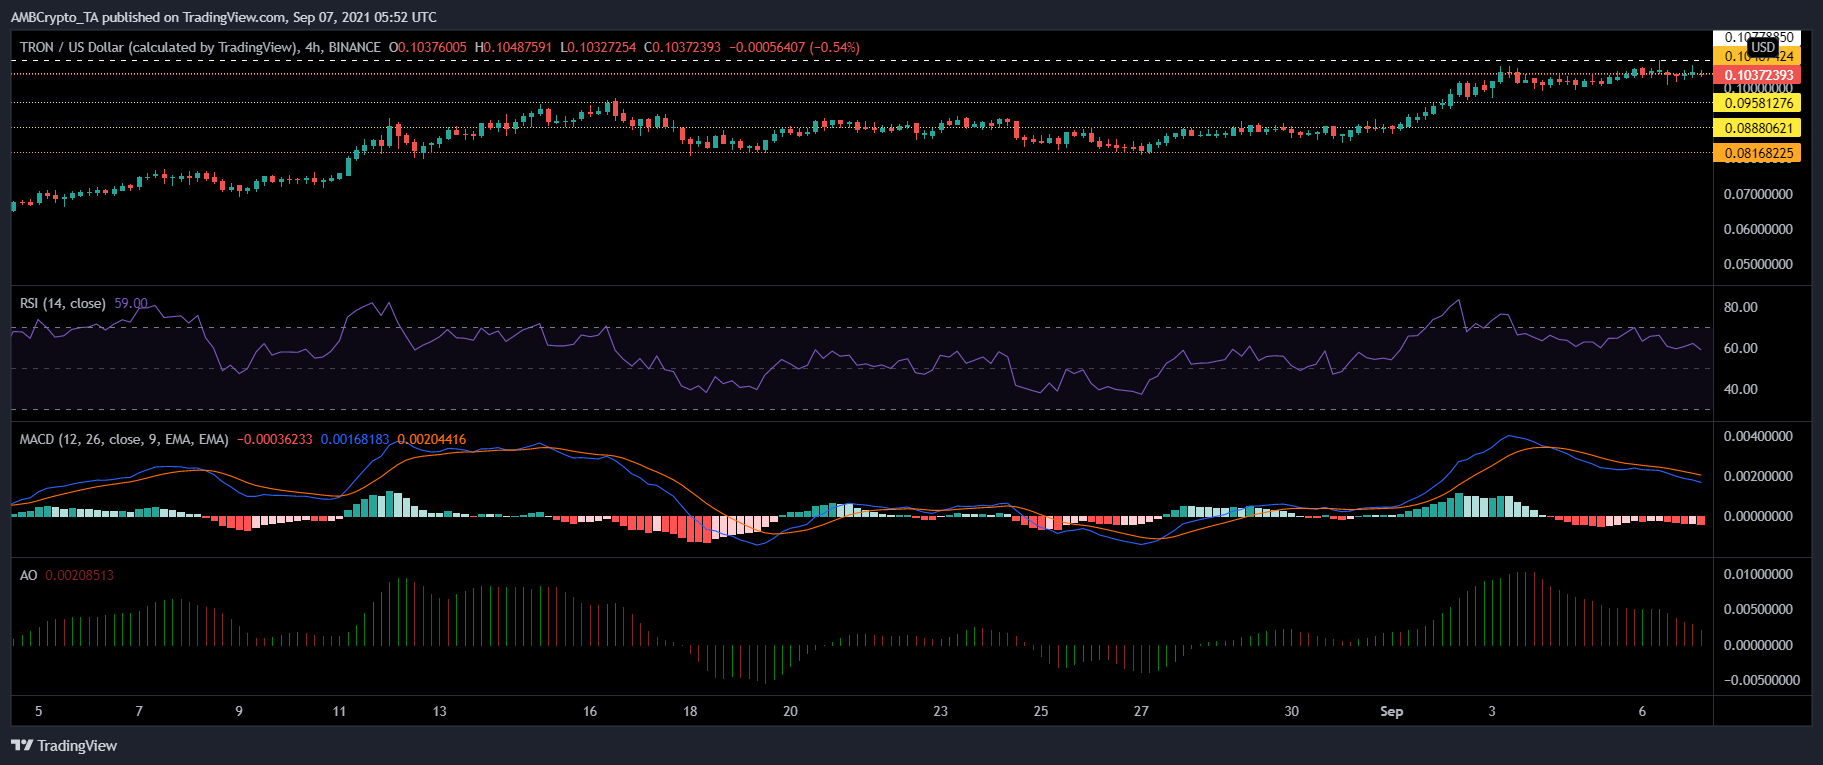
Tron was seen consolidating on its chart and was trading at $0.103. Prices hovered below its multi-month high.
A slip below the current price level would land TRX on $0.095. In case it is unable to sustain over the $0.095 support price line, it will trade at its weekly low of $0.088.
Indicators showed bearish signals for the alt. MACD displayed red bars on its histogram. Awesome Oscillator flashed red signal bars.
Conversely, the Relative Strength Index stood above the 50-mark indicating that buying strength was bullish. In case of the buying strength rising, Tron could break its consolidation on the upside and secure a new multi-month gain at $0.107.
Polygon (MATIC)
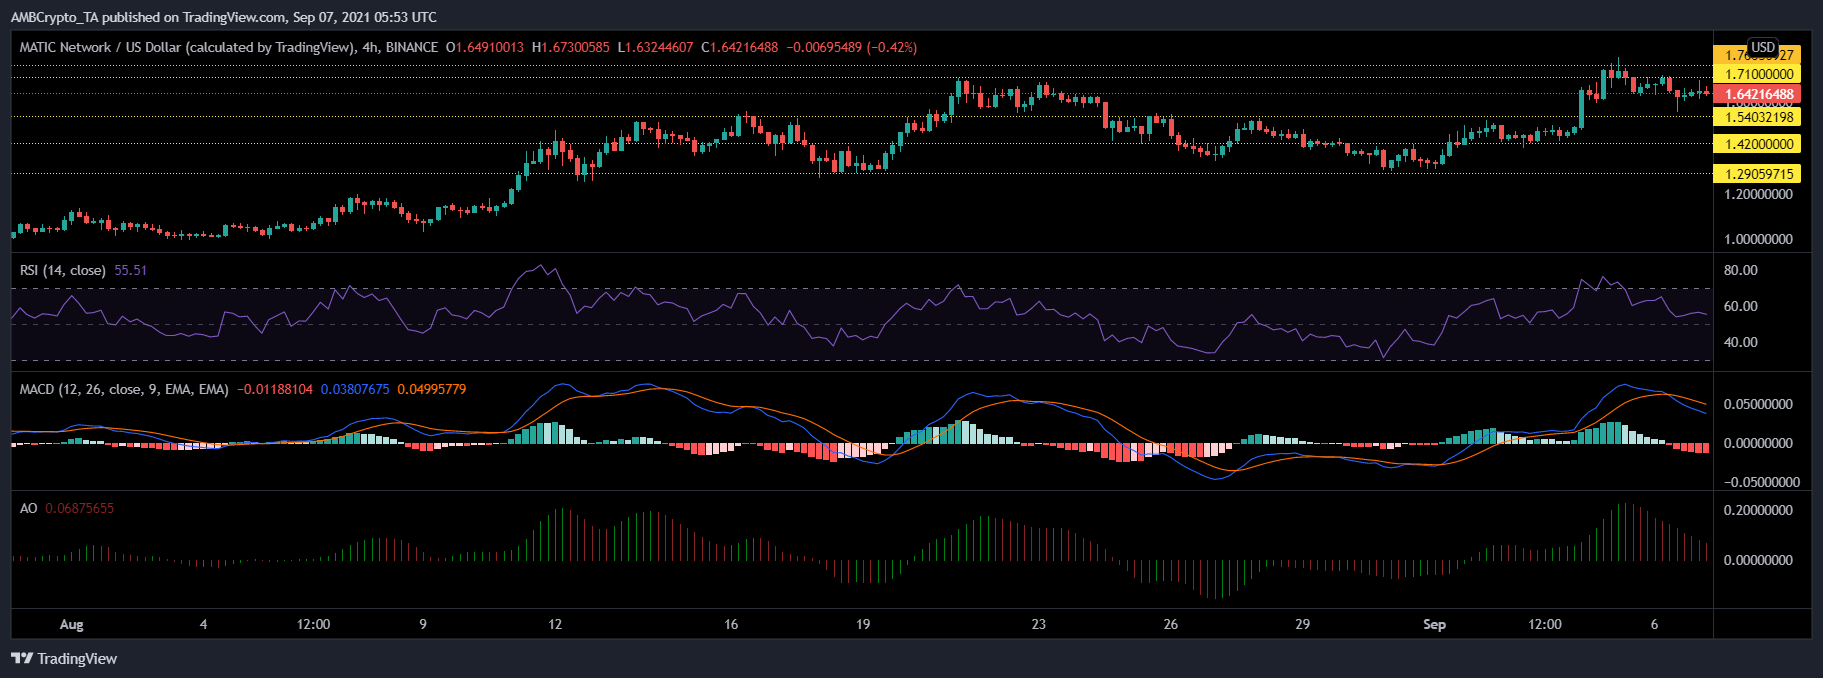
MATIC lost 3.8% over the last 24 hours and was trading at $1.64. Over the past few sessions, MATIC was trading sideways. If it continues on that path over the upcoming sessions, it could dip to $1.50. Failing to maintain prices over $1.50, it could sit on its one week low of $1.42.
On the 4-hour chart, MACD displayed red bars on its histogram. Awesome Oscillator noted red signal bars. Conversely, buying strength still remained over the 50-mark, however, with continuous sessions in red Relative Strength Index could dip below the half-line.
If MATIC moves on the upside, it could attempt to topple over the $1.71 price ceiling, and then revisit its multi-month high of $1.76.
WAVES
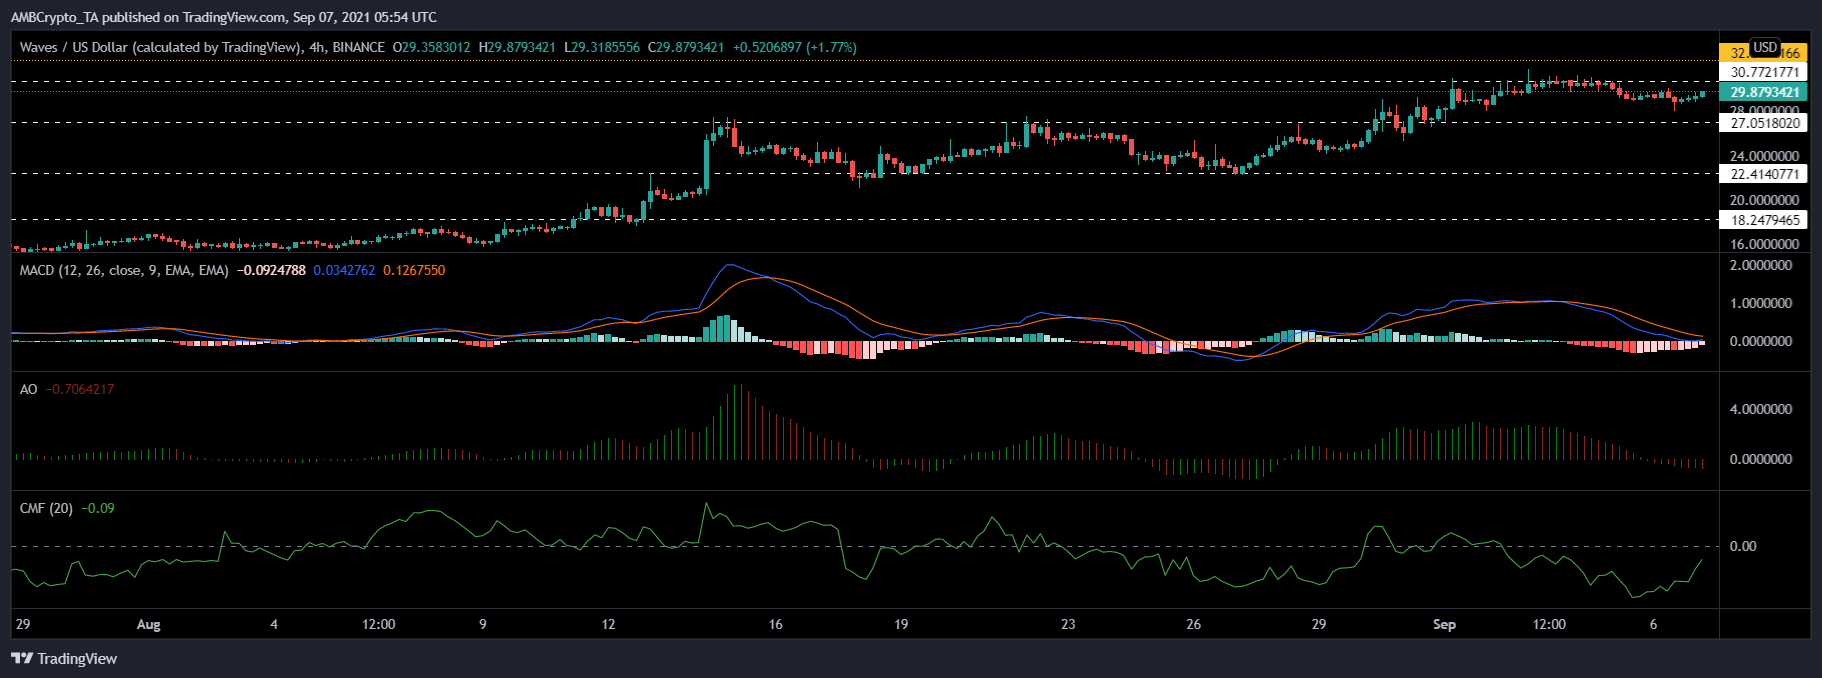
WAVES displayed lateral trading in accordance with many other altcoins. The altcoin was trading at $30.77, notches below its multi-month high. The next support level lay at $27.05 which was also a one-week low for the altcoins. Additional support levels stood at $22.41 and $18.24.
Technical parameters pointed towards negative price action. MACD displayed red bars on its histogram, while Awesome Oscillator observed red signal bars.
Chaikin Money Flow was beneath the mid-line which indicated that capital inflows were less. If WAVES witnesses a price reversal, it could topple over the $30.77 and then revisit the $32.77 price ceiling.