TRON saw neutral momentum in recent weeks, but buyers can look for a dip to…

The information presented does not constitute financial, investment, trading, or other types of advice and is solely the writer’s opinion
- The high volume node at $0.053 has trapped TRON on the price charts since early December.
- A move above the Value Area High could initiate a rally.
Bitcoin continued to trade in the vicinity of the $16.6k mark and has seen a strong move in recent weeks. A move down to $16.2k support can see a dip for TRON as well. This TRX dip can be bought aiming for a small move upward.
Read TRON’s Price Prediction 2023-24
TRON has defended the $0.052 level of support since June. It dropped to $0.049 in mid-November but was quick to recover back above this support level. It exhibited lowered volatility recently as it traded within a high-volume node.
The H12 bullish breaker has been defended since late November and could serve as support yet again
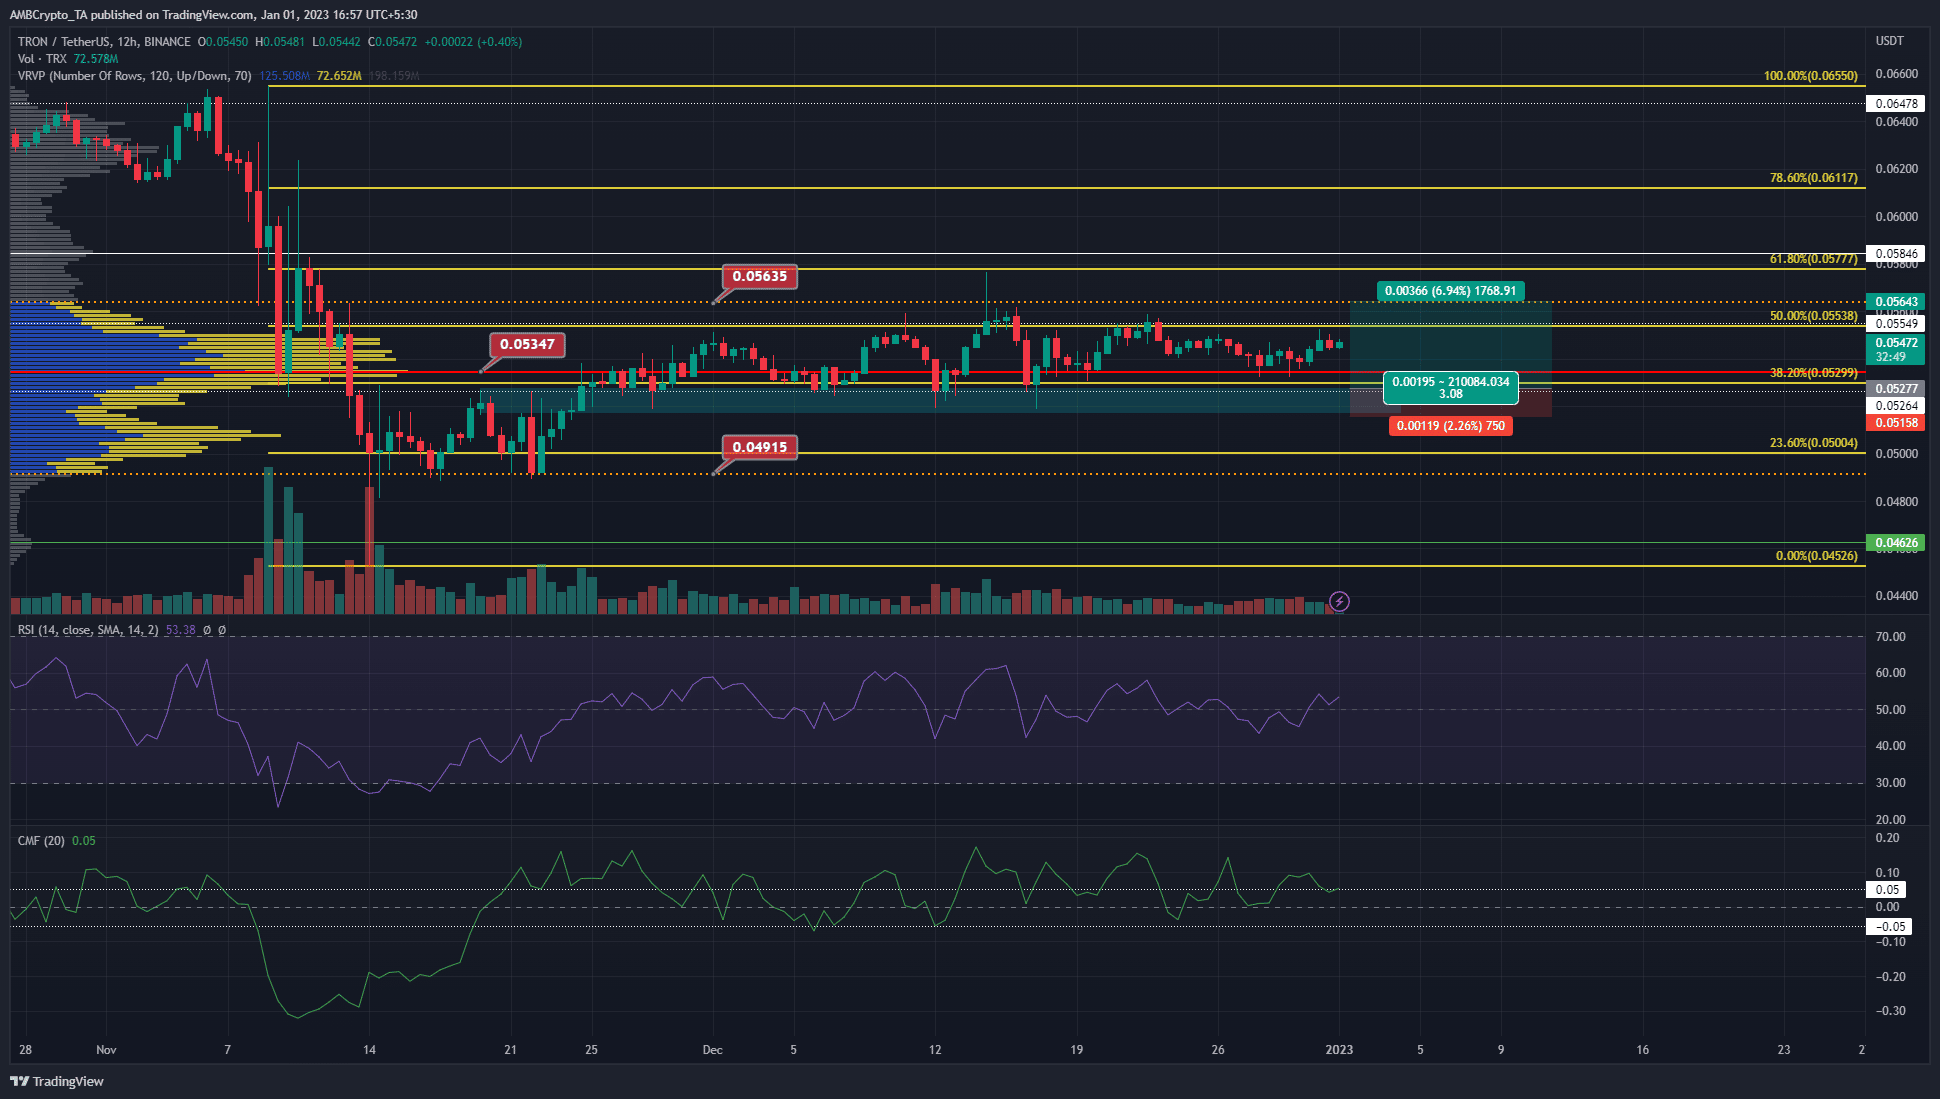
The Visible Range Volume Profile showed the Value Area Low and High to lie at $0.04915 and $0.05635 respectively. The Point of Control, the highest volume node in the visible range was at $0.05347. It represented a significant level of support for TRX.
Throughout December, TRON has not done much on the price charts in terms of setting up a significant trend. The rest of the crypto market has not seen a strong trend either, especially Bitcoin and Ethereum which clung to their respective short-term support and resistance levels
How many TRXs can you get for $1?
Based on the price action we can see that the $0.051-$0.052 acts as a support because it is a bullish breaker on the 12-hour chart. It also has confluence with the horizontal level of support at $0.052, and the 38.2% Fibonacci retracement level. Hence, it could offer a buying opportunity on a dip. To the north, the resistance at $0.056 can be used by buyers to take profit.
Open Interest remains flat but rising CVD meant buyers have their tails up

Coinalyze data showed that TRON was likely in a phase of accumulation. The Open Interest has been flat since mid-December alongside the price. This was due to the lack of a trend, with lower timeframe scalpers likely being the ones who profited during the past two weeks trading TRON.
However, the spot CVD metric has been steadily rising since August. While the CVD shot higher, the price formed a series of lower highs. This indicated that buying pressure was persistent, but the intermittent waves of selling and the overall sentiment in the market were not conducive to an uptrend. The funding rate was also negative showing bearish sentiment in recent weeks.