Tron [TRX]: The technical hurdles to consider before taking a long position

Disclaimer: The findings of the following analysis are the sole opinions of the writer and should not be considered investment advice.
As anticipated by a previous article, Tron [TRX] reversed from its falling-wedge-like structure before pulling back into bearish clutches. For over eight weeks, the sellers strived to breach the $0.063-support (now resistance).
The recent decline below this level has positioned TRX below its 20/50 EMA to depict a bearish edge.
With the bulls maintaining week-long trendline support (white) in the $0.062-zone, TRX could now head into a rather sluggish phase. At press time, TRX was trading at $0.06277.
TRX 4-hour Chart

The altcoin saw an expected bearish pull after taking a one-eighty from the 50 EMA (cyan) in its falling wedge breakout rally. This reversal, alongside the market sentiment, led to a substantial blow for TRX bulls as they failed to defend the $0.063-level.
With the 20 EMA (red) and the 50 EMA (cyan) still looking south, sellers would continue to maintain their near-term advantage on the charts. A convincing close below the trendline support would only reaffirm this narrative.
After a classic double-bottom breakout, the two-week trendline resistance (white, dashed) curtailed the buying efforts and reignited the bearish pressure. Hereon, TRX could aim to find rebounding grounds from the $0.0623-baseline.
All in all, a break above the $0.063-resistance could change the near-term narrative in favor of bulls. Here, the trendline resistance (dashed) could pose as recovery barriers in the $0.064-zone. An inability to do this could provoke further bearish pulls. A close below the $0.062-baseline can expose TRX to a retest of the $0.0614-mark.
Rationale
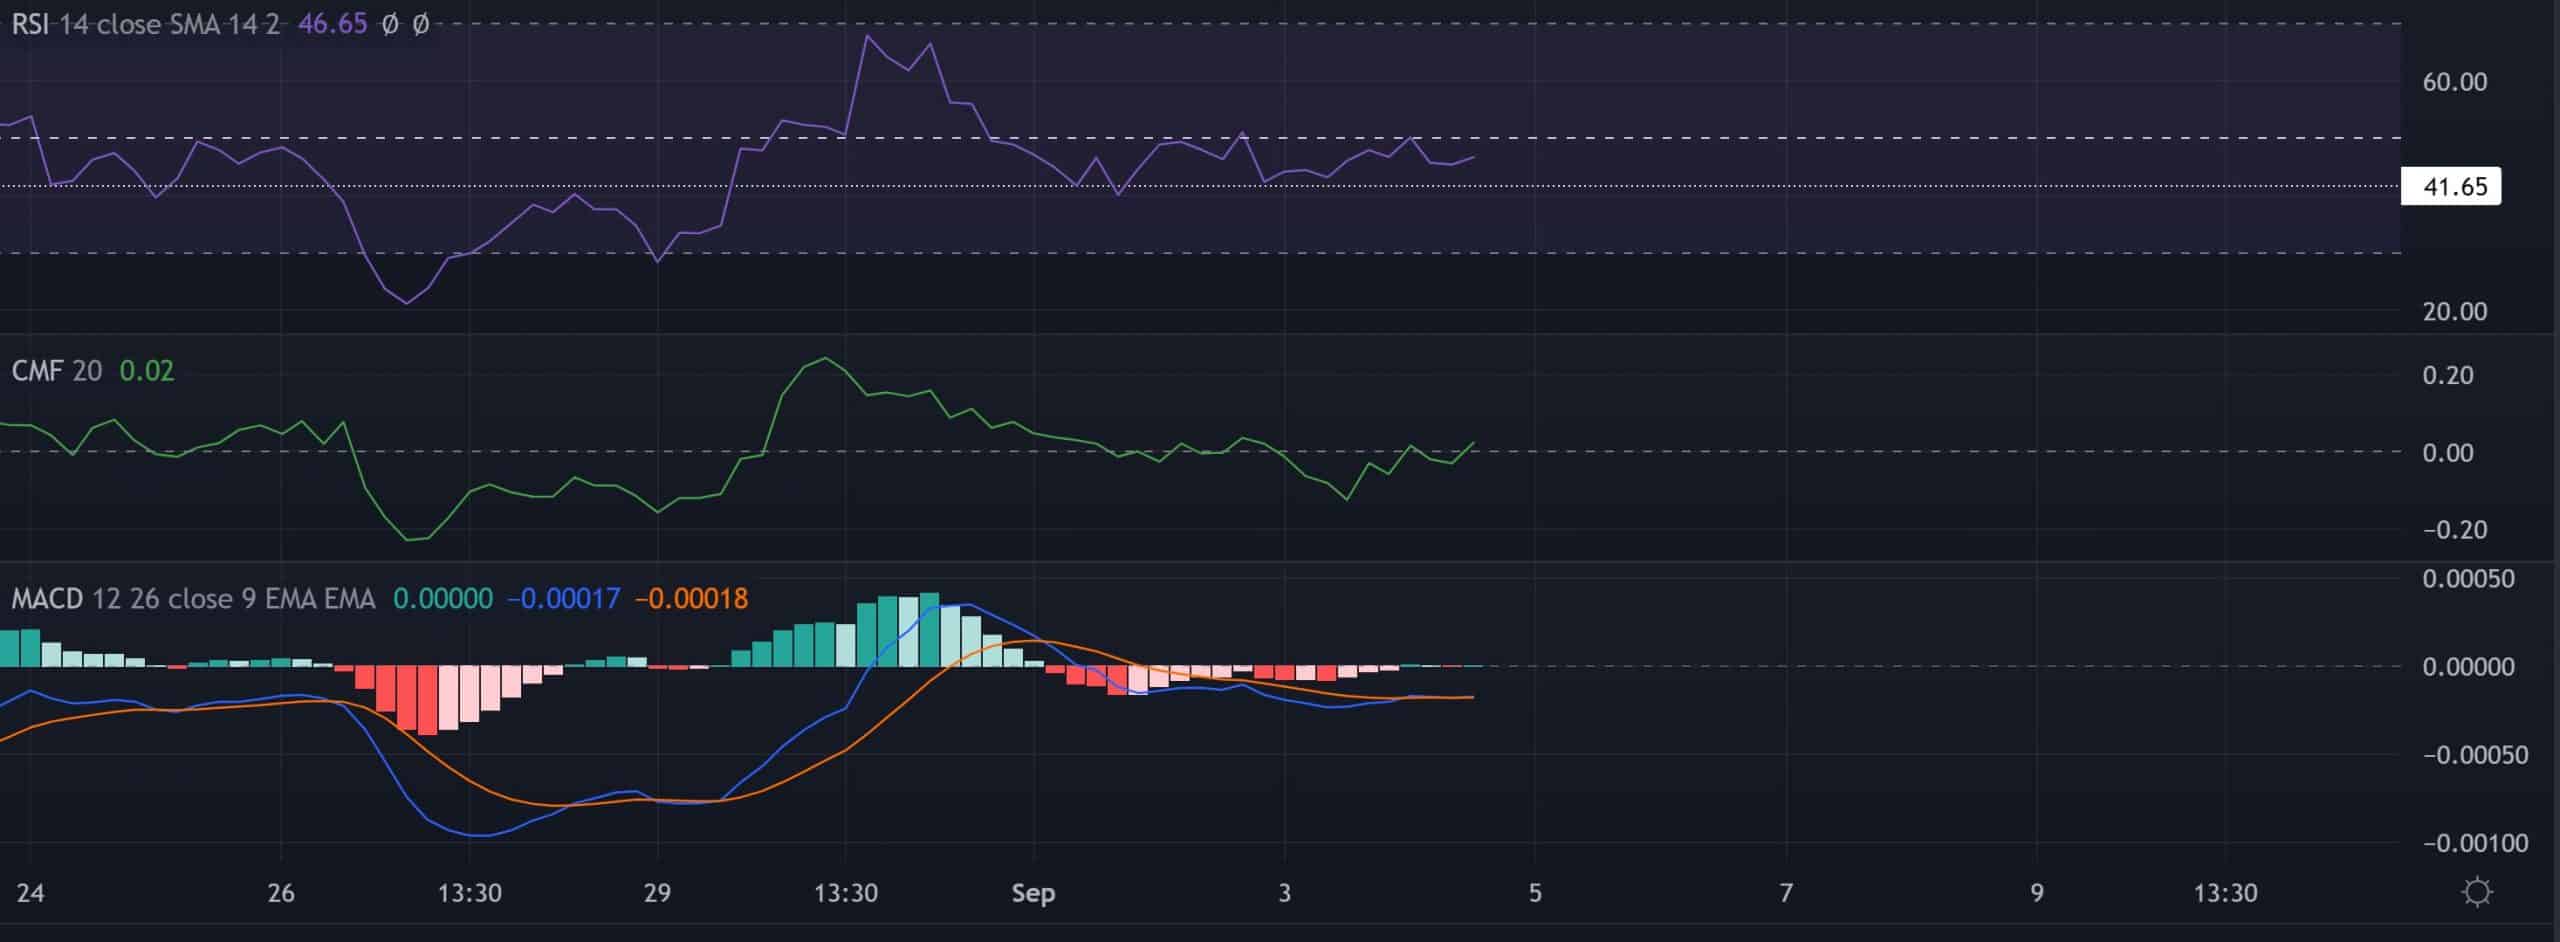
The Relative Strength Index (RSI) compressed in the 41-50 range. The buyers should look for a potential close above equilibrium before taking a long position.
Interestingly, the CMF hiked above zero to depict an increasing buying edge. However, a convincing crossover on the MACD is still required to confirm the increased bullish power.
Conclusion
TRX’s close below the 20/50 EMA after losing its $0.063-level has repositioned the coin into a plausible bearish track. To invalidate the bearish inclinations, buyers must reclaim the above level and propel a sway above the two-week trendline resistance. The targets would remain the same as discussed.
Finally, investors/traders should consider Bitcoin’s movement and its impact on broader market perception to make a profitable move.