Tron’s [TRX] latest rejection might have the following implications

Disclaimer: The findings of the following analysis are the sole opinions of the writer and should not be considered investment advice
Earlier in April, TRON broke out past a critical level of resistance on the price charts. News of the release of its native stablecoin, USDD, saw the coin surge by nearly 20% after this resistance was retested as support. Longer-term traders and investors have already seen wild volatility on TRON price charts in recent weeks.
In the next few days, the possibility of a further downside would be magnified if TRX breaks down beneath the aforementioned crucial horizontal level.
TRX- 12 Hour Chart
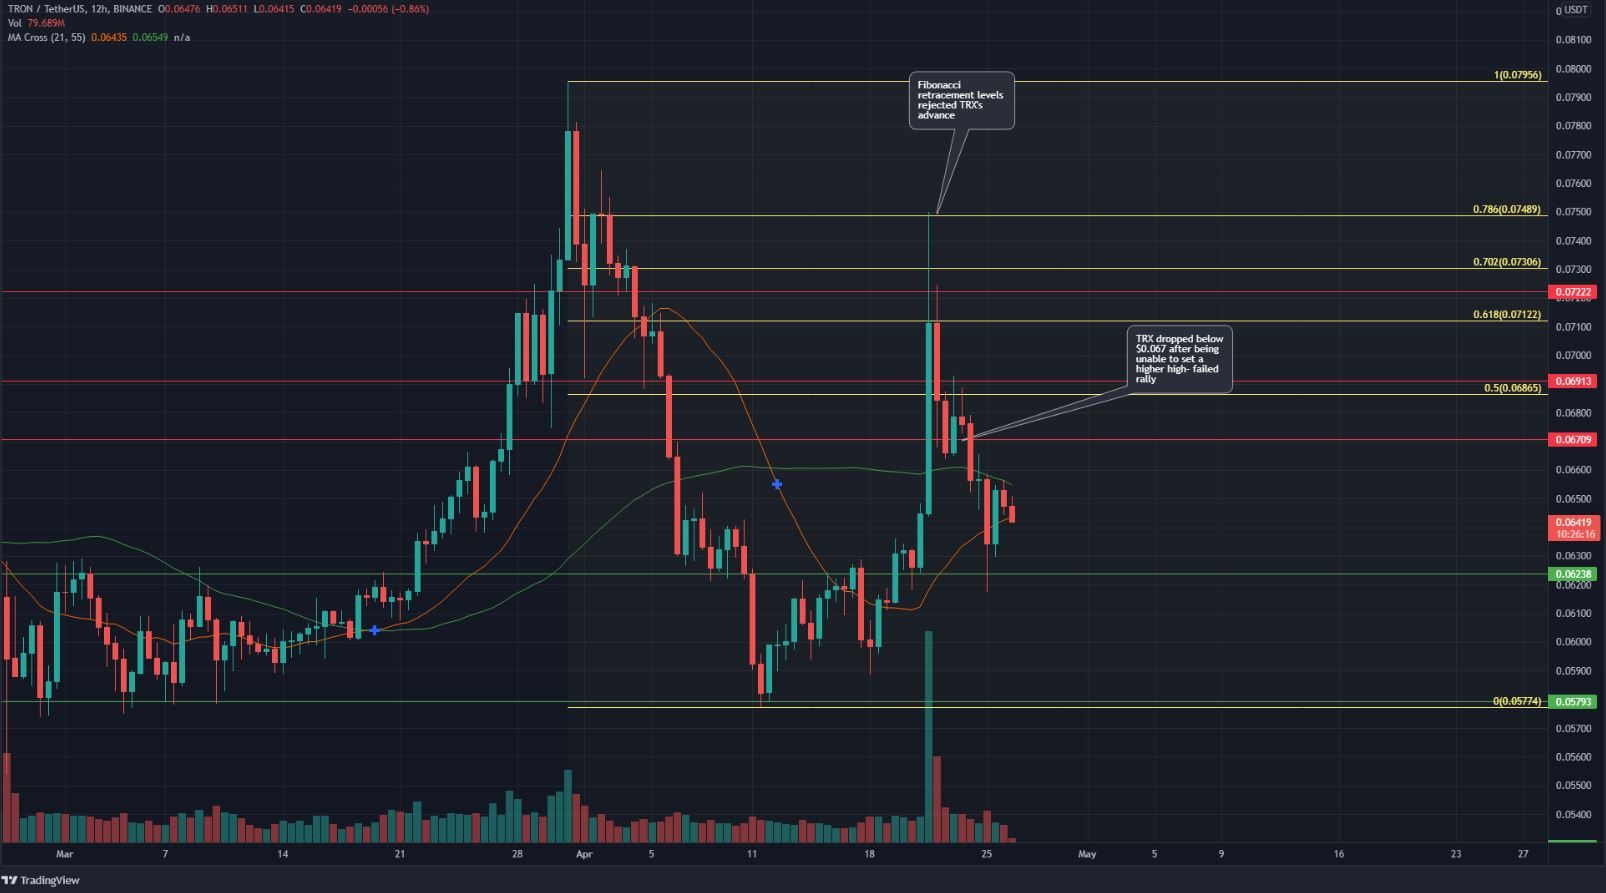
The critical level of support is the $0.062 horizontal level. Earlier this month, it acted as both support, resistance, and support once more as TRX dropped to $0.0579 and rebounded. Another area to watch out for is the $0.063-$0.065 zone.
At the time of writing, the price was inside this zone, which has been important all through 2022. If TRX drops below $0.063, it would be likely that the price would descend further in the next couple of weeks. However, a weak bounce could materialize from within this zone.
Based on the down move from $0.079 to $0.057, a set of Fibonacci retracement levels (yellow) was plotted. It showed the 78.6% and 61.8% retracement levels to be at $0.074 and $0.071. On the 12-hour chart, the price was unable to push past the former level and unable to close above the latter.
Combined with the losses of the past week, it indicated a firm rejection at resistance for TRX. It also pointed to further downside towards $0.062 and possibly lower.
Rationale
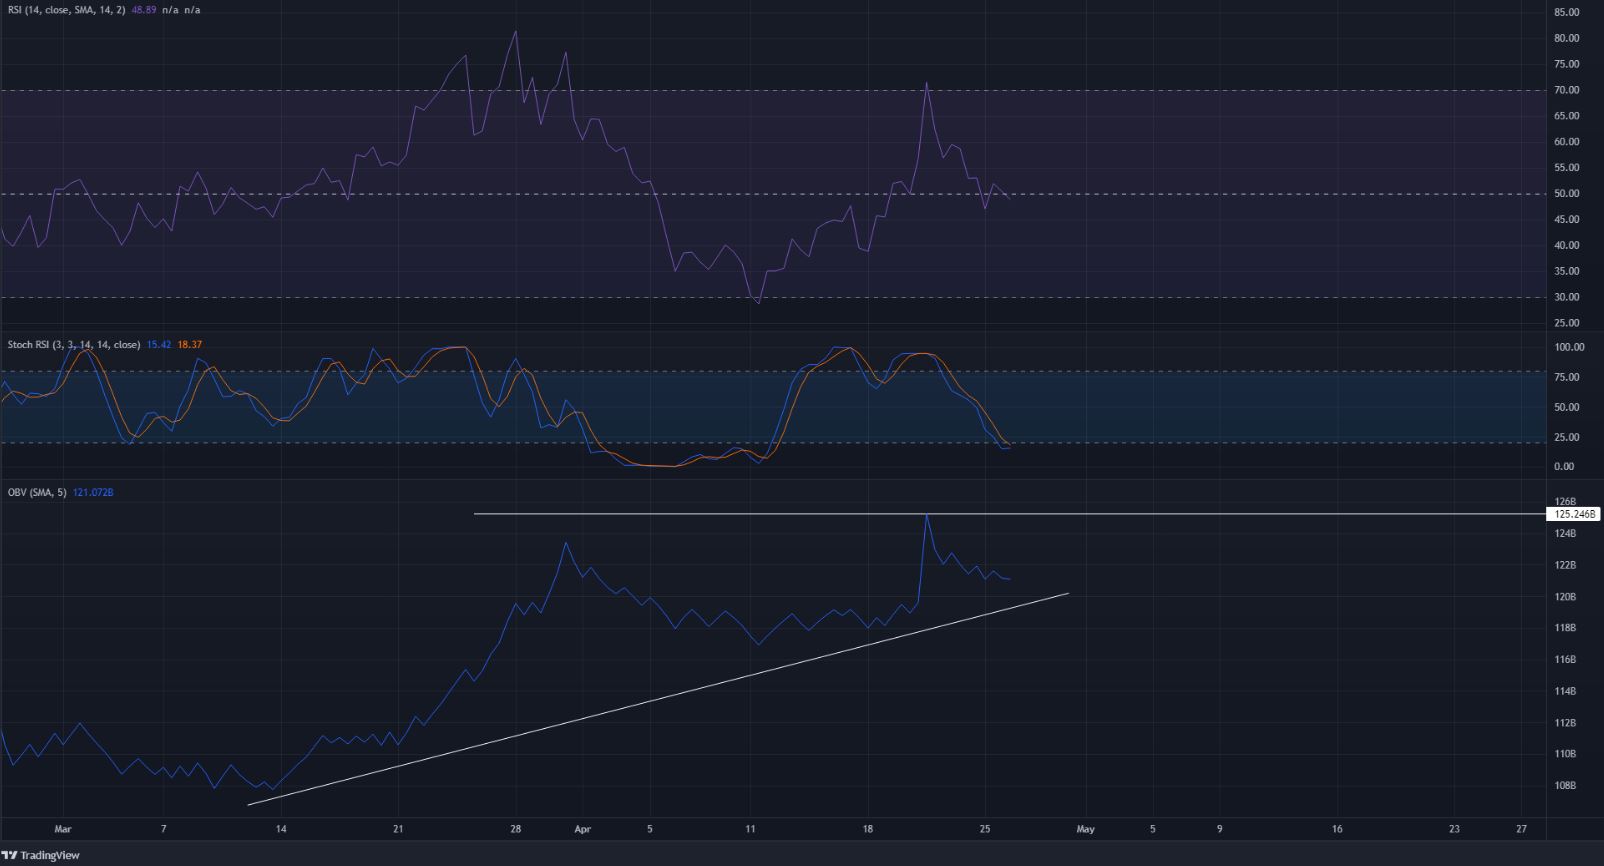
The RSI managed to climb above neutral 50 and stayed there for a few days. However, at the time of writing, it looked likely to dip beneath 50. This meant that the uptrend of the past few days is unlikely to be sustained, and a downtrend could become apparent. At the same time, the Stochastic RSI approached the oversold territory to show a possible minor bounce from the $0.063-$0.065 area.
On the other hand, the OBV did not dive as much as the price did. This suggested that buying volume has been much stronger than selling volume over the past week.
Conclusion
The price action and the momentum signalled a bearish turn for TRON over the past couple of days. It highlighted how a move towards the $0.062 support level could be seen in the next few days.
The OBV, however, showed that buyers still have some strength in the market for a rally.


