Uniswap trading at a long term demand zone- Where can sellers benefit

Disclaimer: The findings of the following analysis are the sole opinions of the writer and should not be considered investment advice.
Data on DeFi Pulse showed decentralized exchange Uniswap to have a Total Locked Value of $7.04 billion, making it the fifth-largest decentralized protocol by TVL.
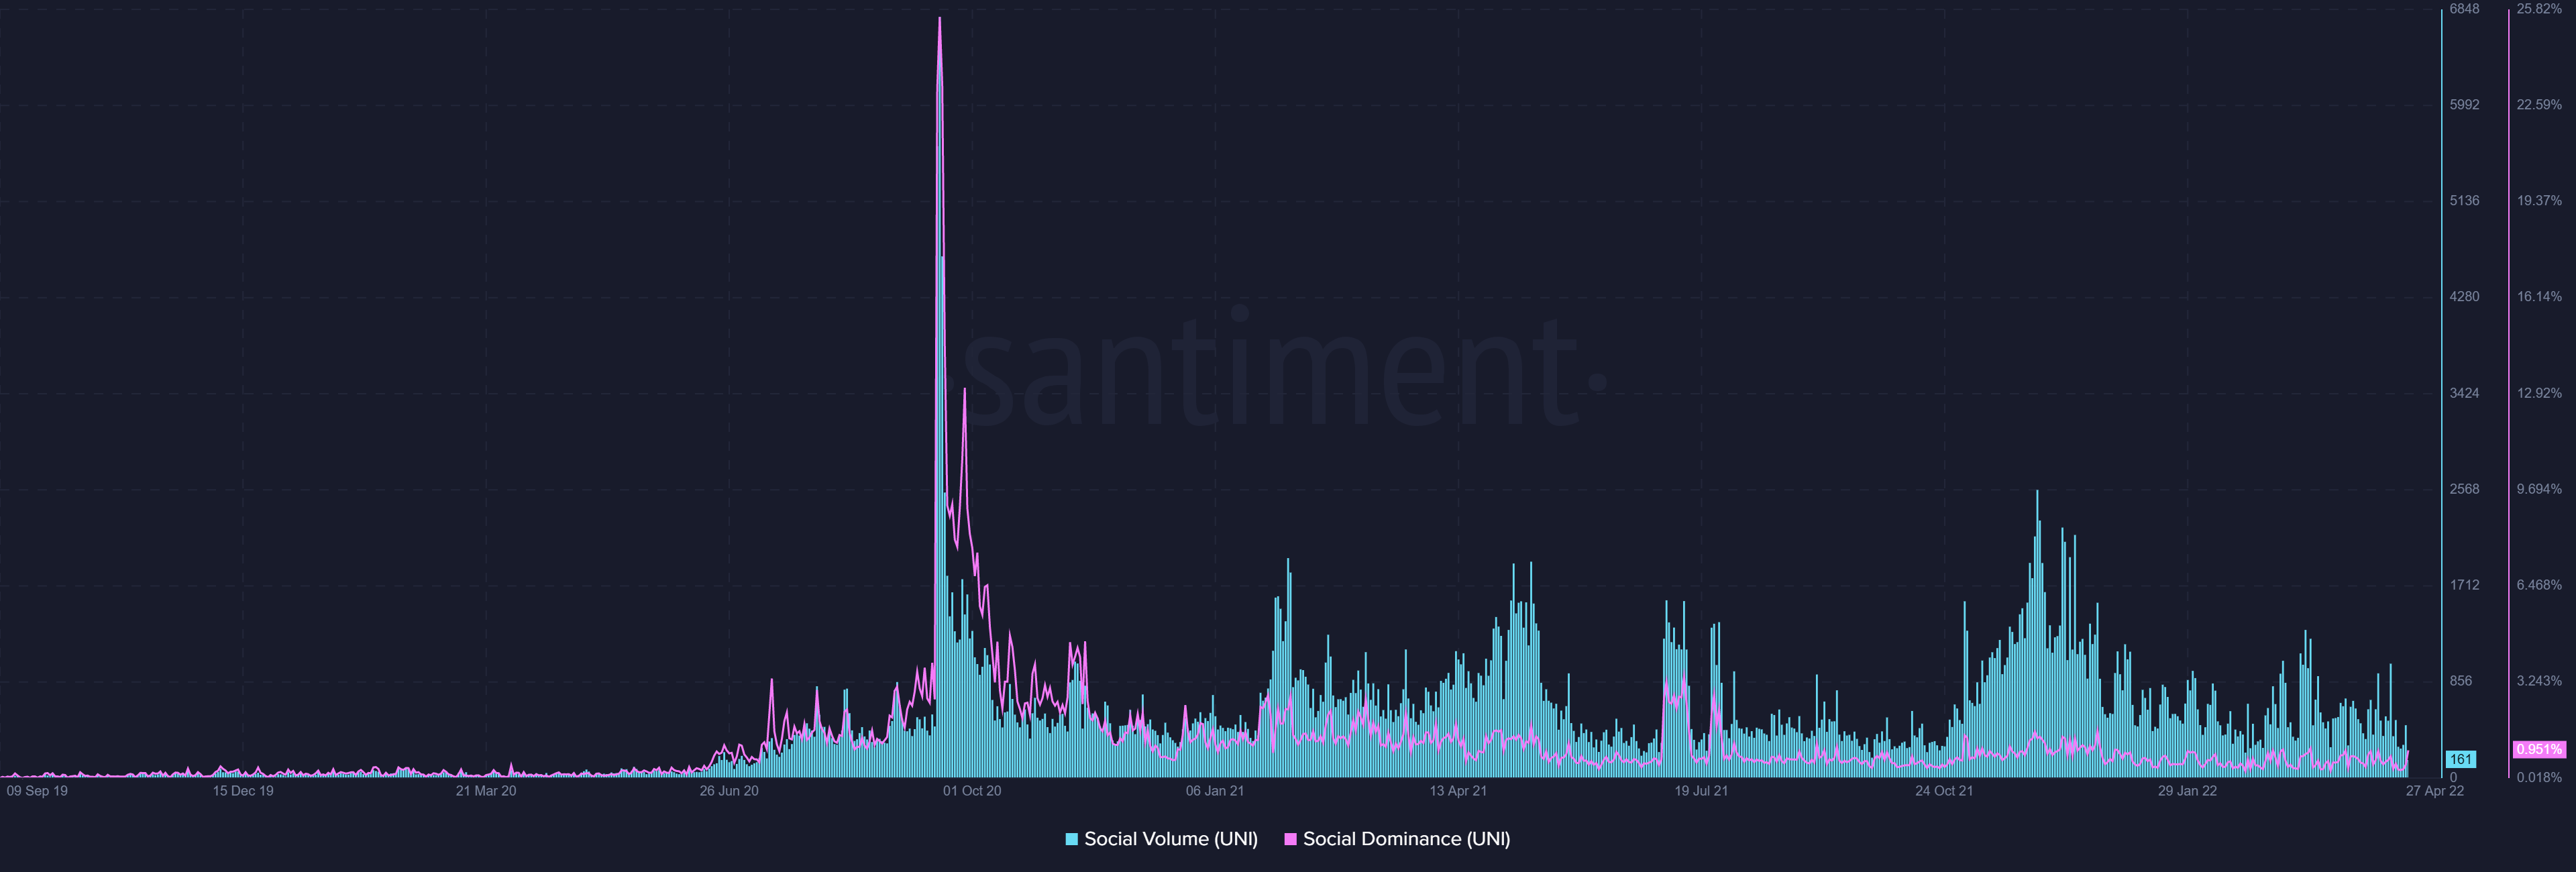
Metrics revealed more than a thousand GitHub submissions, but at the same time, its social presence has been diminishing. This was according to metrics like social volume, from Santiment.
On the charts, the price has been on a steady decline since last November. Recovery did not look likely at the time of writing.
UNI- 1 Day Chart
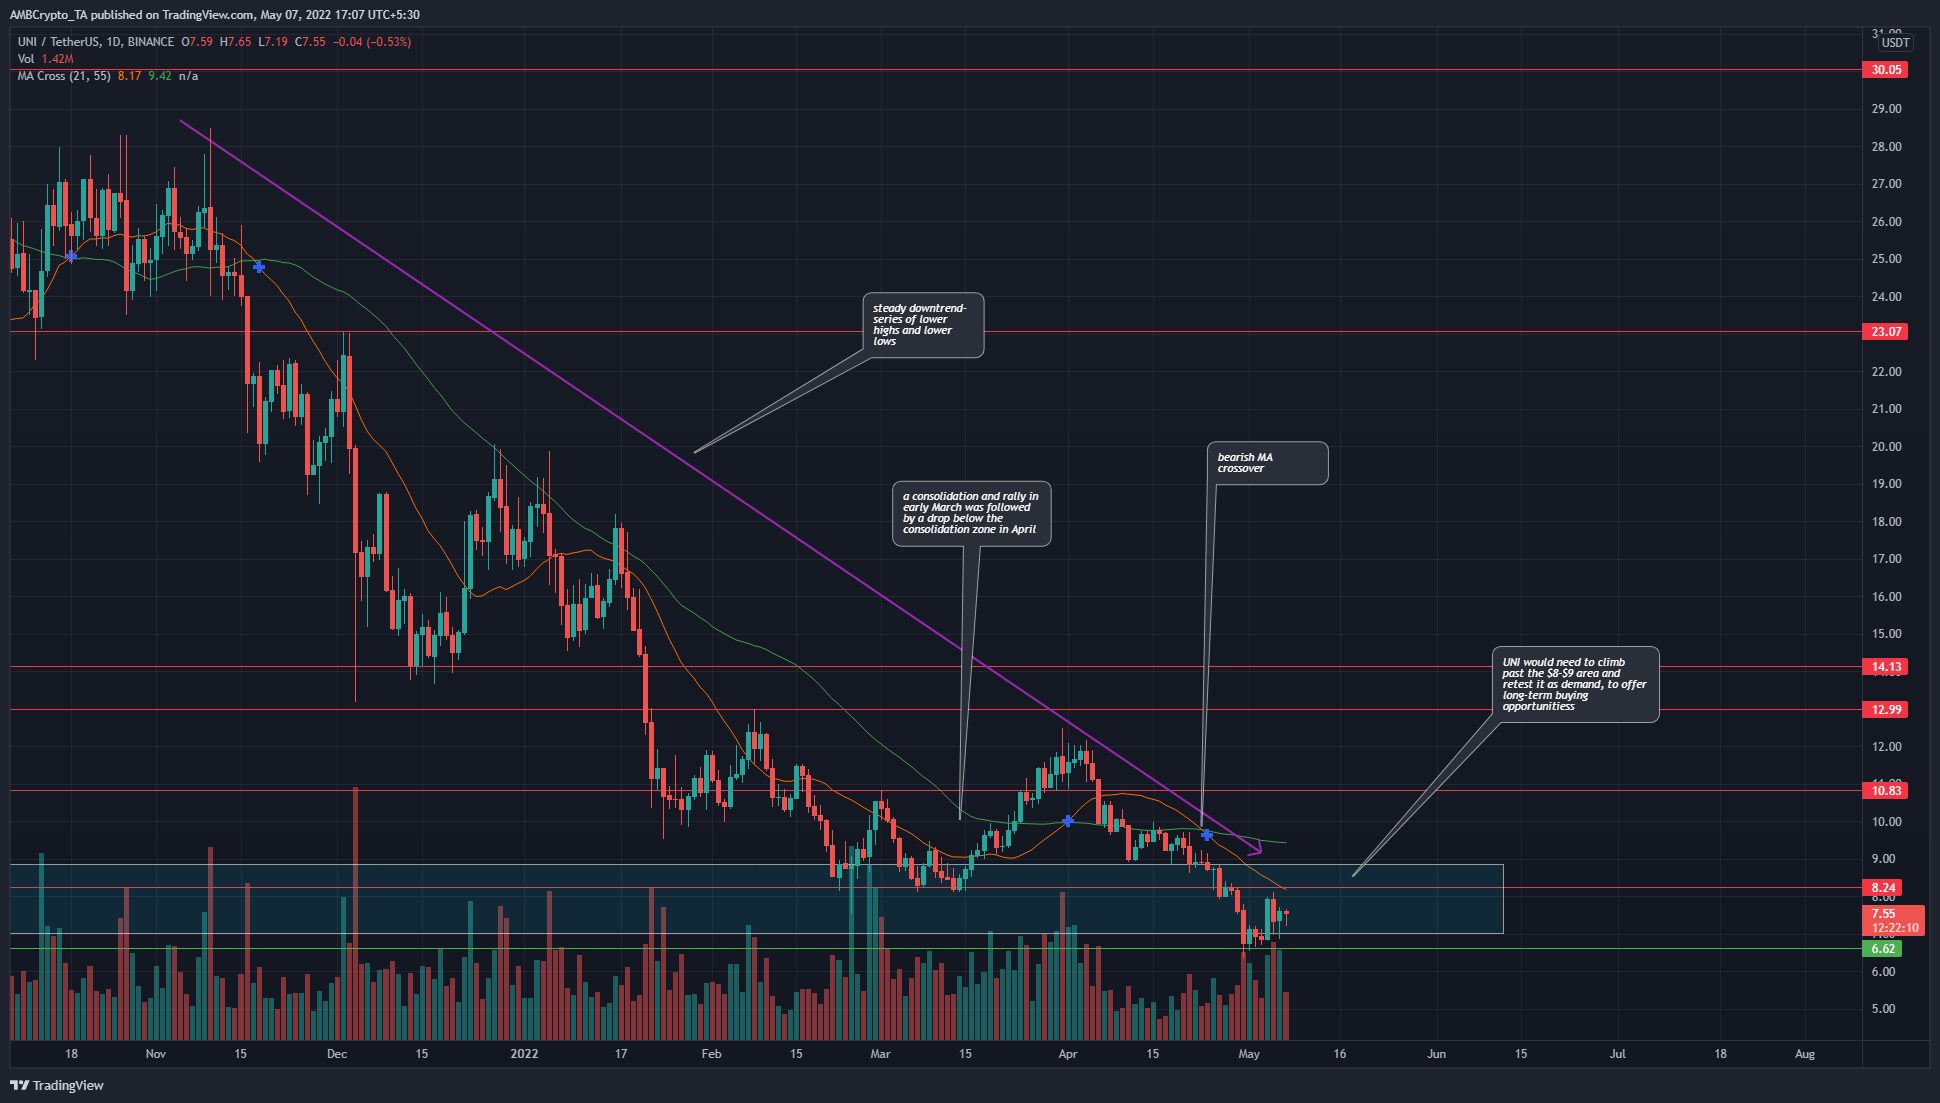
On the charts, UNI had a grim outlook, especially on the larger timeframes such as the daily. The persistent downtrend was reinforced in late March when a rally from the $8.24 support failed to climb close a daily session above the $12 mark. Like the rest of the crypto market, UNI has seen a steady bleed in its price since the beginning of April.
However, it slipped beneath the $8.24 level, and going forward, the $8-$9 area is likely to offer strong resistance to any bullish move.
Therefore, trading with the trend is the best option, and a rejection could materialize in the $8-$9 area in the next few days.
Rationale
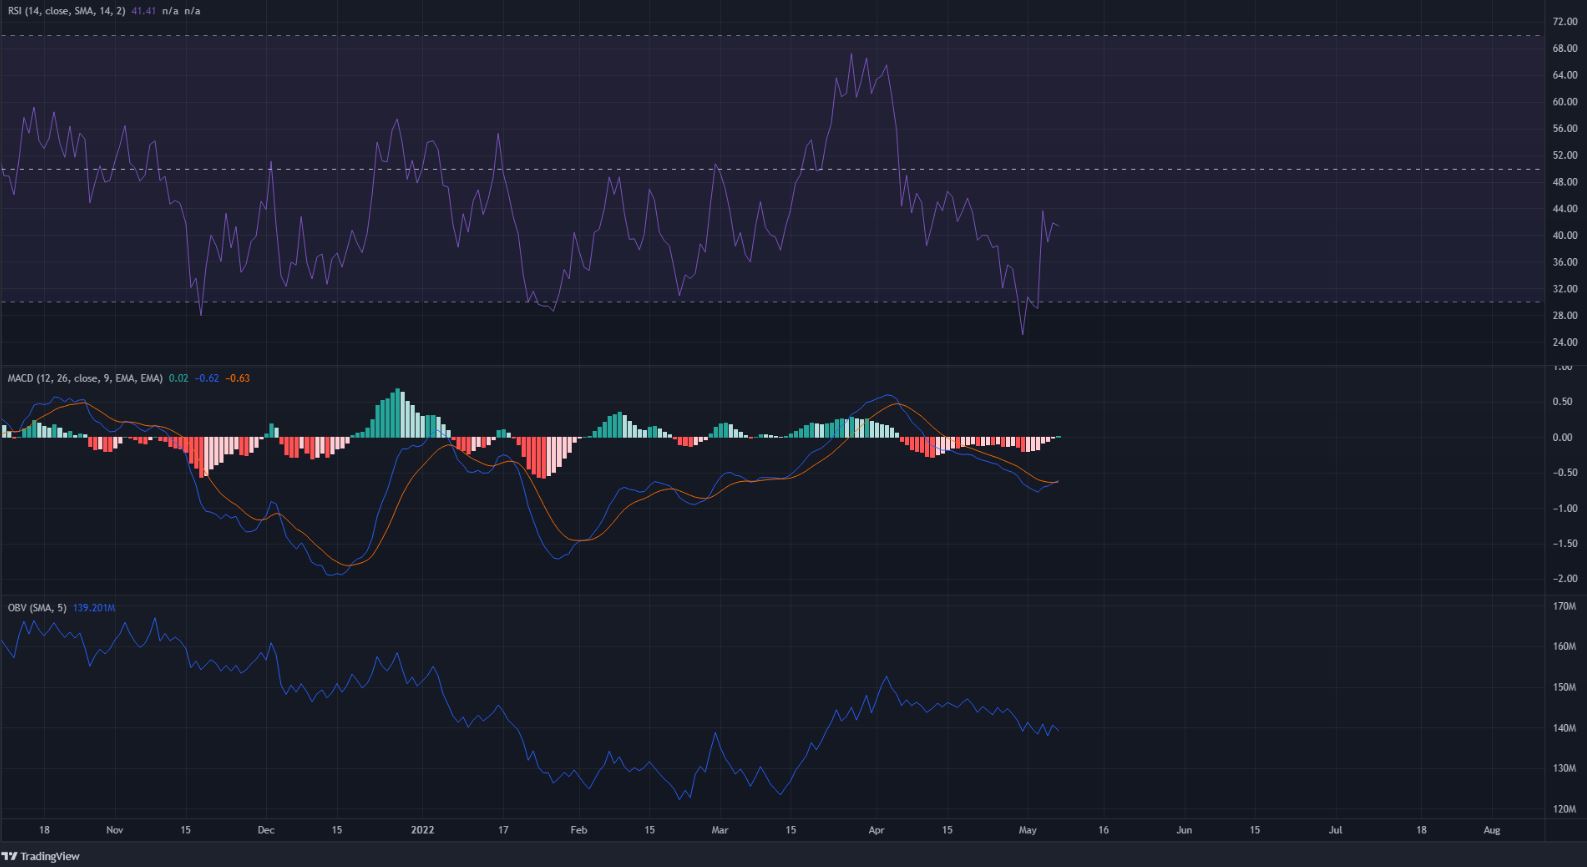
The RSI has been below neutral 50 since late October, with brief forays above the line. This was suggestive of a steady downtrend, except for a period of two weeks in the latter half of March.
Both the MACD and the RSI showed bearish momentum had the upper hand, although the MACD could signal a pullback with a bullish crossover beneath the zero line. Such a pullback on the downtrend could see UNI retest the $8 area of resistance.
The OBV saw a decent bounce since March, but going back further, the downtrend seems to be strong evidence of seller strength. The OBV has also steadily declined in April, and this trend downward could continue.
Conclusion
The price could revisit the $8-$9 resistance zone in the days to come. Short positions can be opened, as they align with the longer-term trend. Unless the Uniswap token can push past $10, the market structure on the daily timeframe would remain bearish.


