What Bitcoin’s S2F deviation means for its $100k projections

Bitcoin, at the time of writing, was seemingly on its way to recovery. As is always the case, a period of sustained movement always births the question – Can BTC touch $100,000? This is a crucial question, especially since according to some, the cryptocurrency should already be at or close to $100k.
A look at Bitcoin’s 4-year cycle might help us figure out by when BTC would hit $100,000.
A major deviation
That should’ve been the case presently had Bitcoin followed the path laid down by PlanB’s Stock-to-Flow (S2F) ratio model. This model is based on the logic of ‘scarcity driving value.’
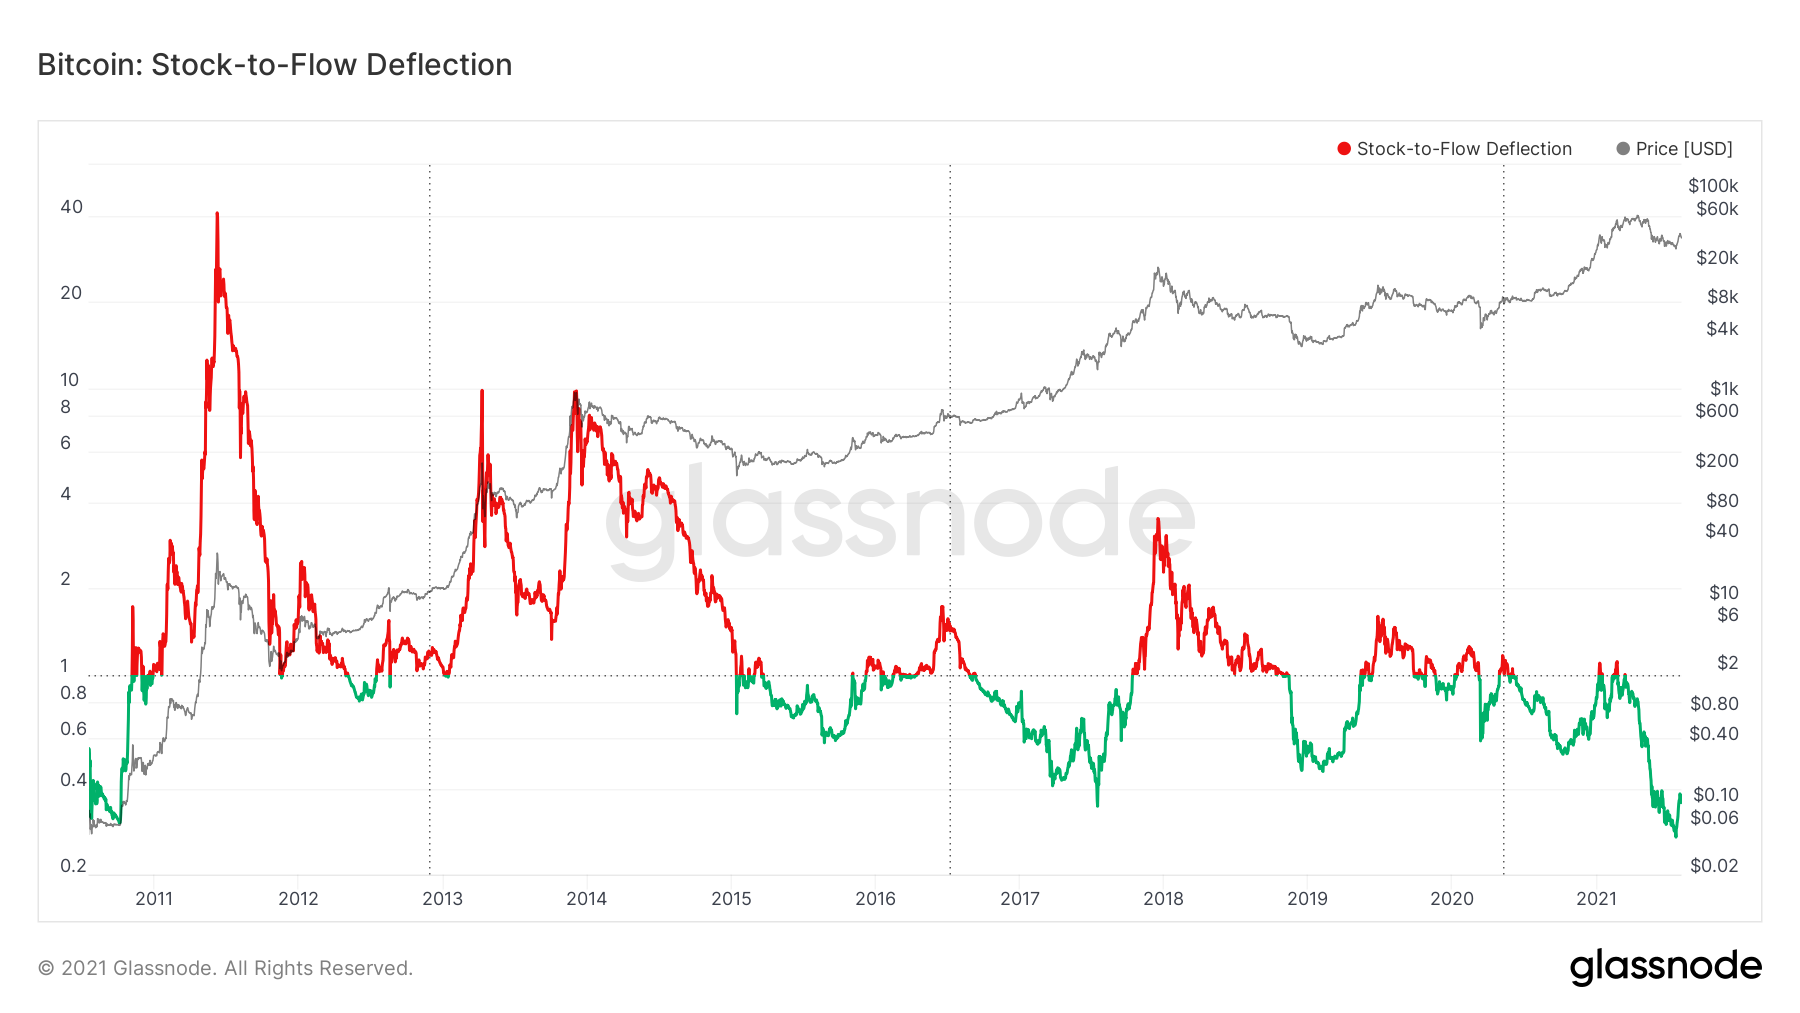
If you look at the S2F deflection chart, you can see that despite the rally which pushed BTC to trade at $40,515, the metric placed BTC at its cheapest over the course of 10 years. While the price of the king coin has consistently risen over time, the indicator seems to be undervaluing the cryptocurrency.
However, focusing on the “when” part, BTC still has some time before it hits the aforementioned level. The S2F ratio seems to suggest that the current deviation from Bitcoin’s predicted price point is similar to the Nov 2018 deviation.
Back then, the price was close to $5k-$6k and the predicted price was close to $9k. It took 6 months for the price action to correct itself and BTC was back on the path by June 2019
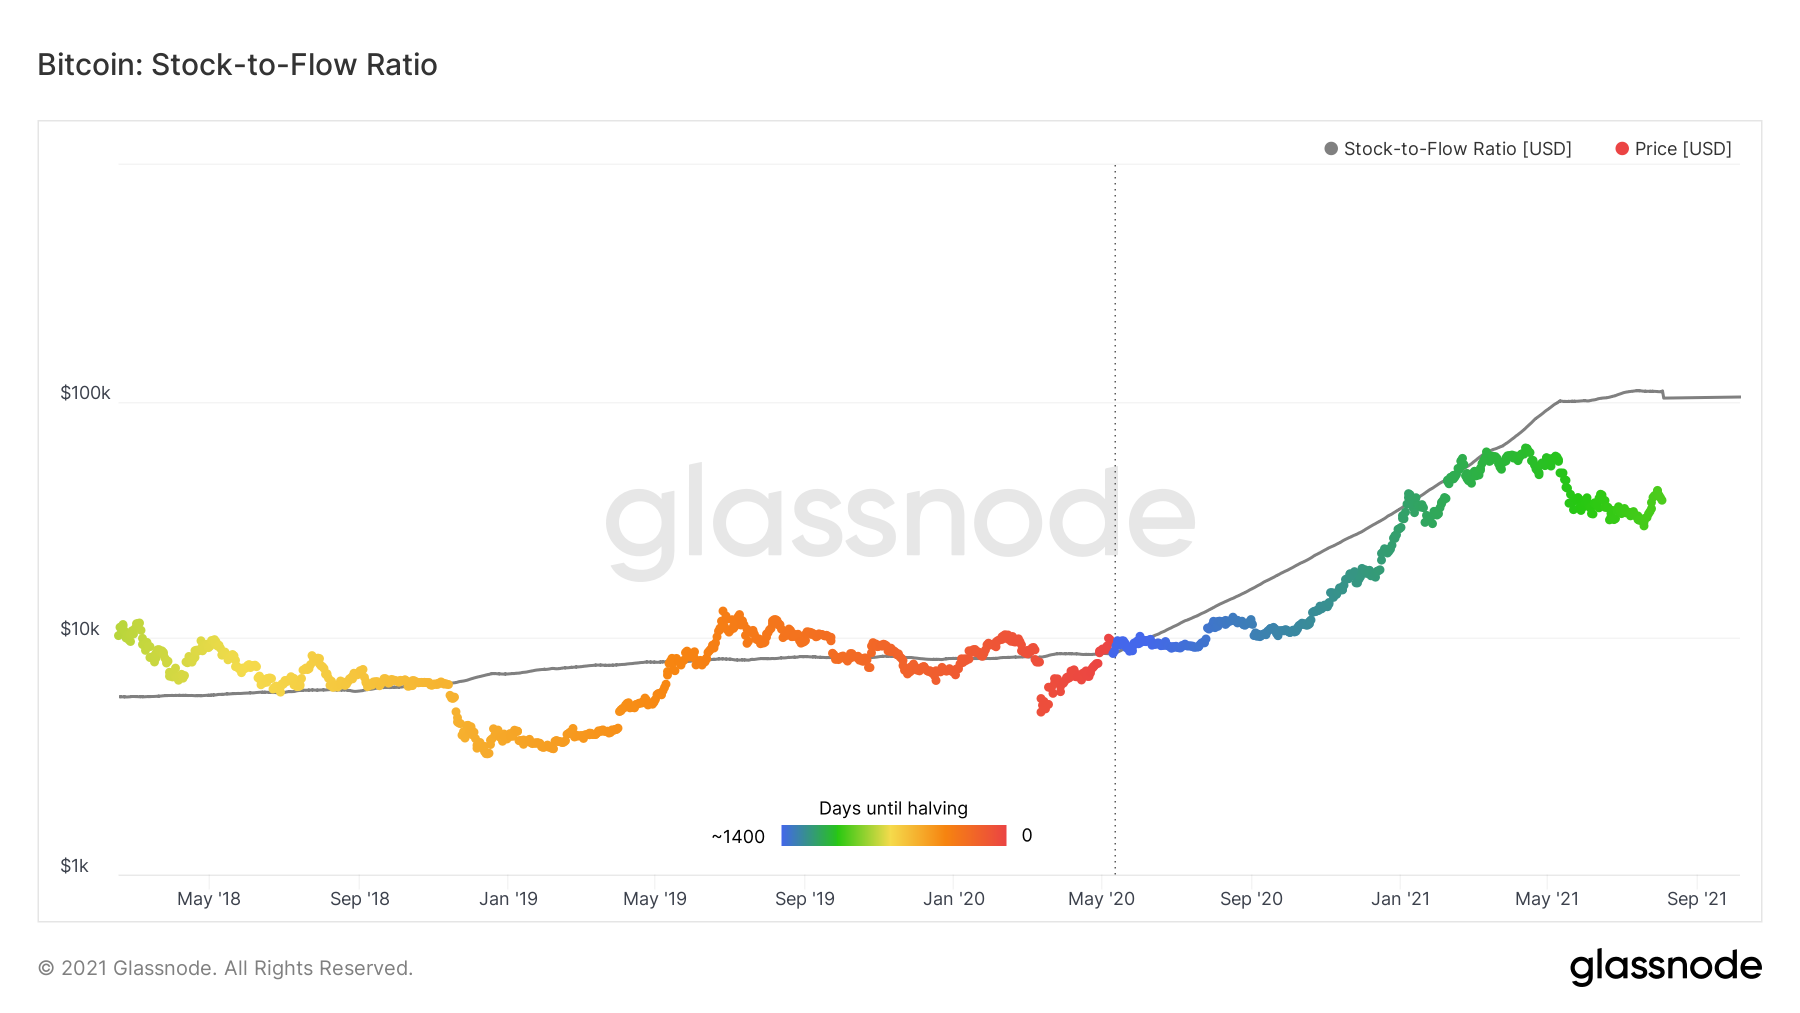
So, if that historical movement is taken into account, one should expect a few more months before Bitcoin hits $100k. Since a rally might just be in motion going forward, BTC might soon achieve that price point.
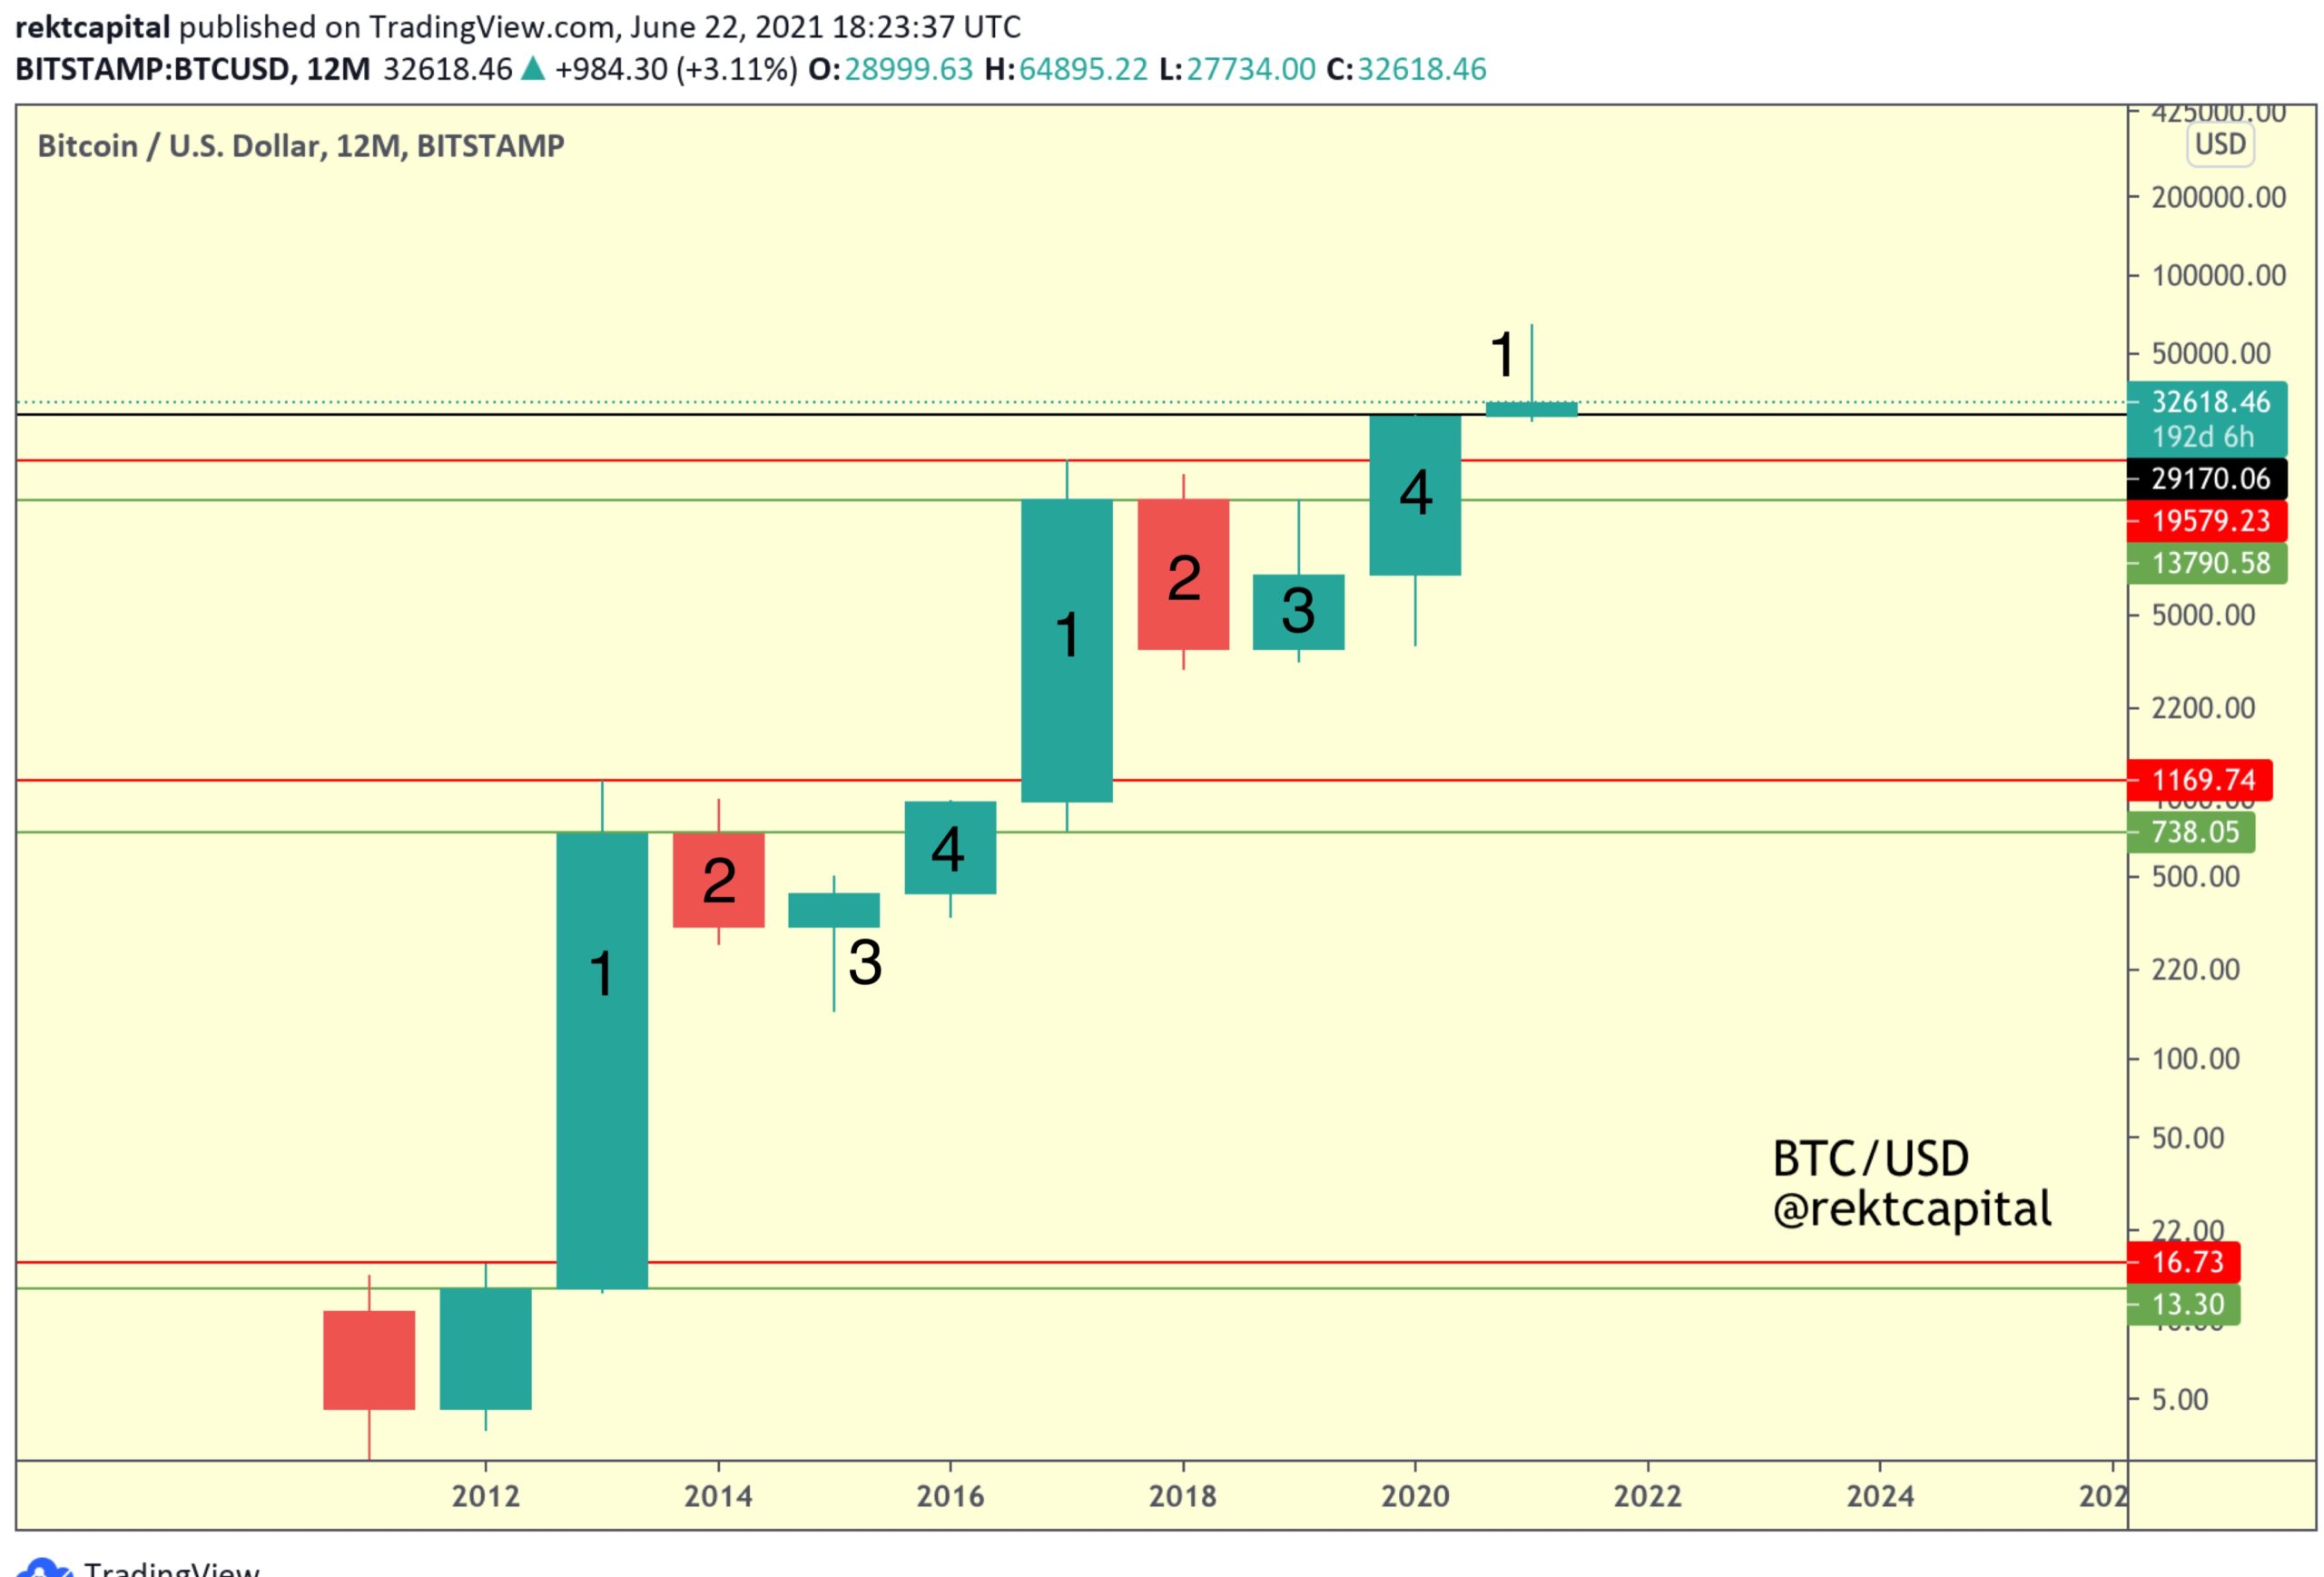
Additionally, Bitcoin’s 4-year cycle retracement finally happened as the $29k resistance turned into support. It now seems to be following the traditional pattern of a market structure. Thus, the only way ahead is up, albeit not immediately.
How to identify the $100k trend?
A couple of metrics need to be observed here as they will be the first indicators of where the price is heading. First of all, the adjusted SOPR (aSOPR) needs to maintain its movement above 1. This is necessary for a steady uptrend. Should it fall below, losses can enter the market.
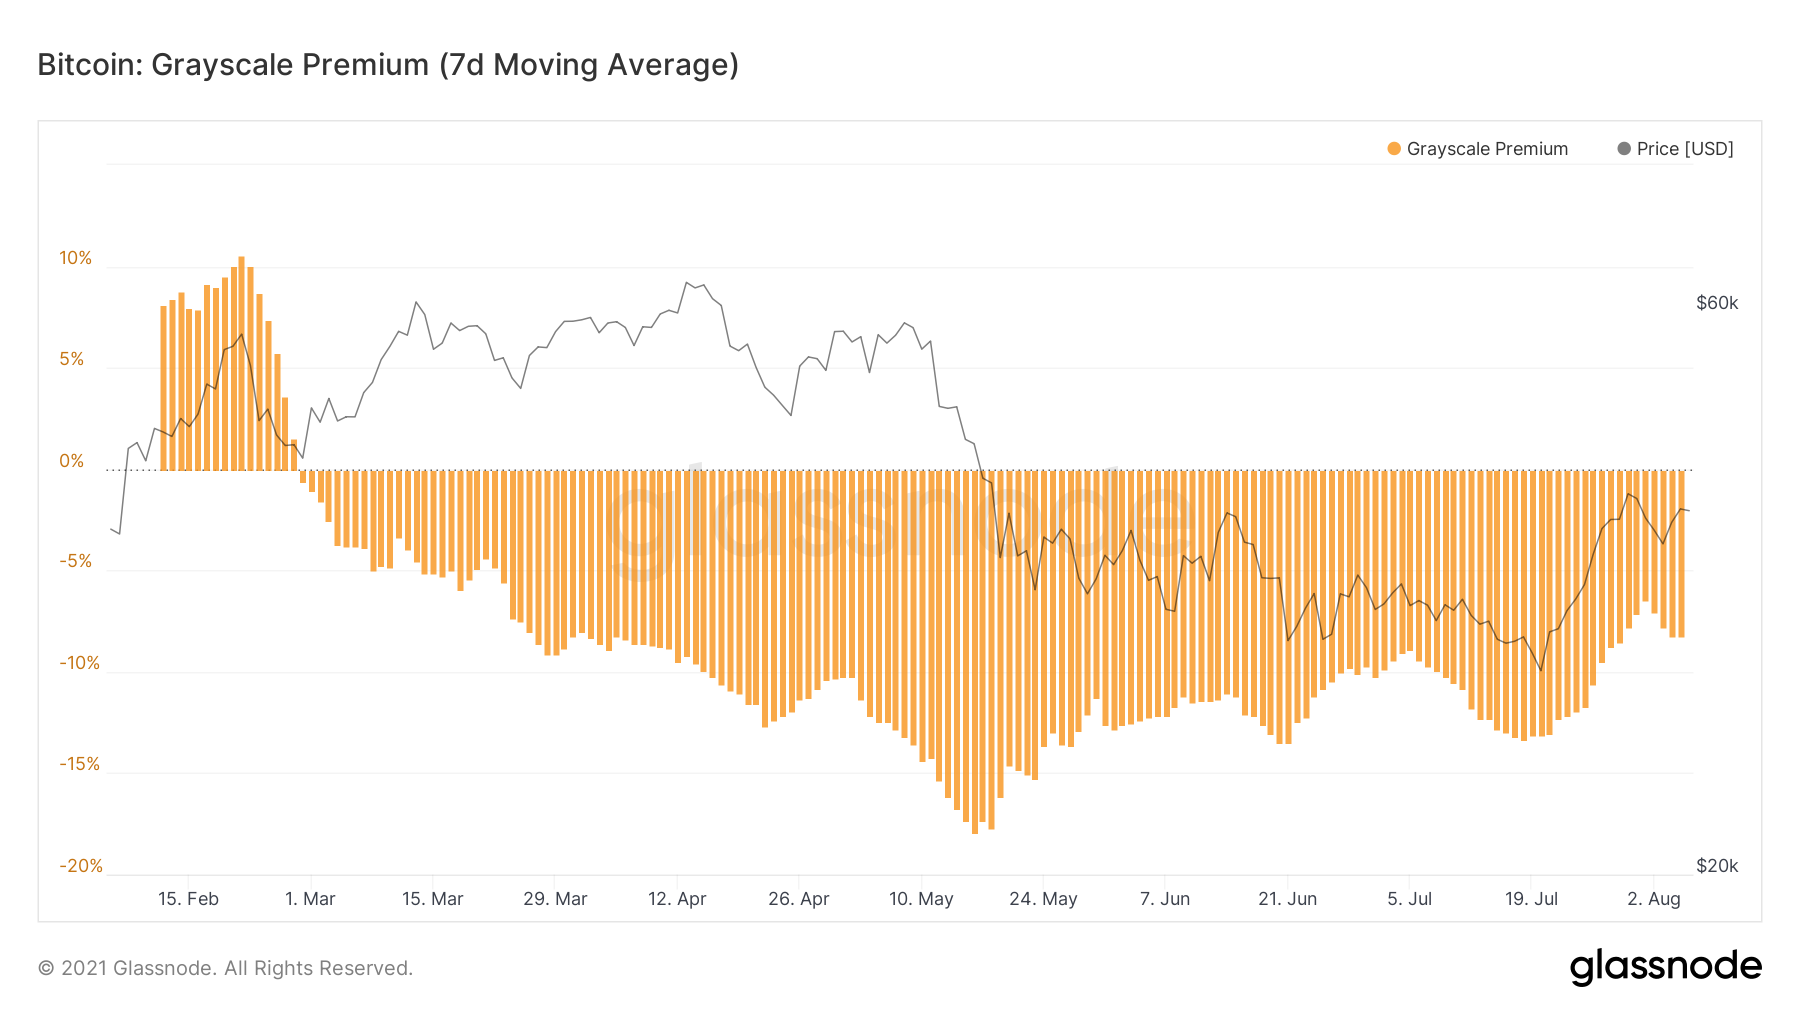
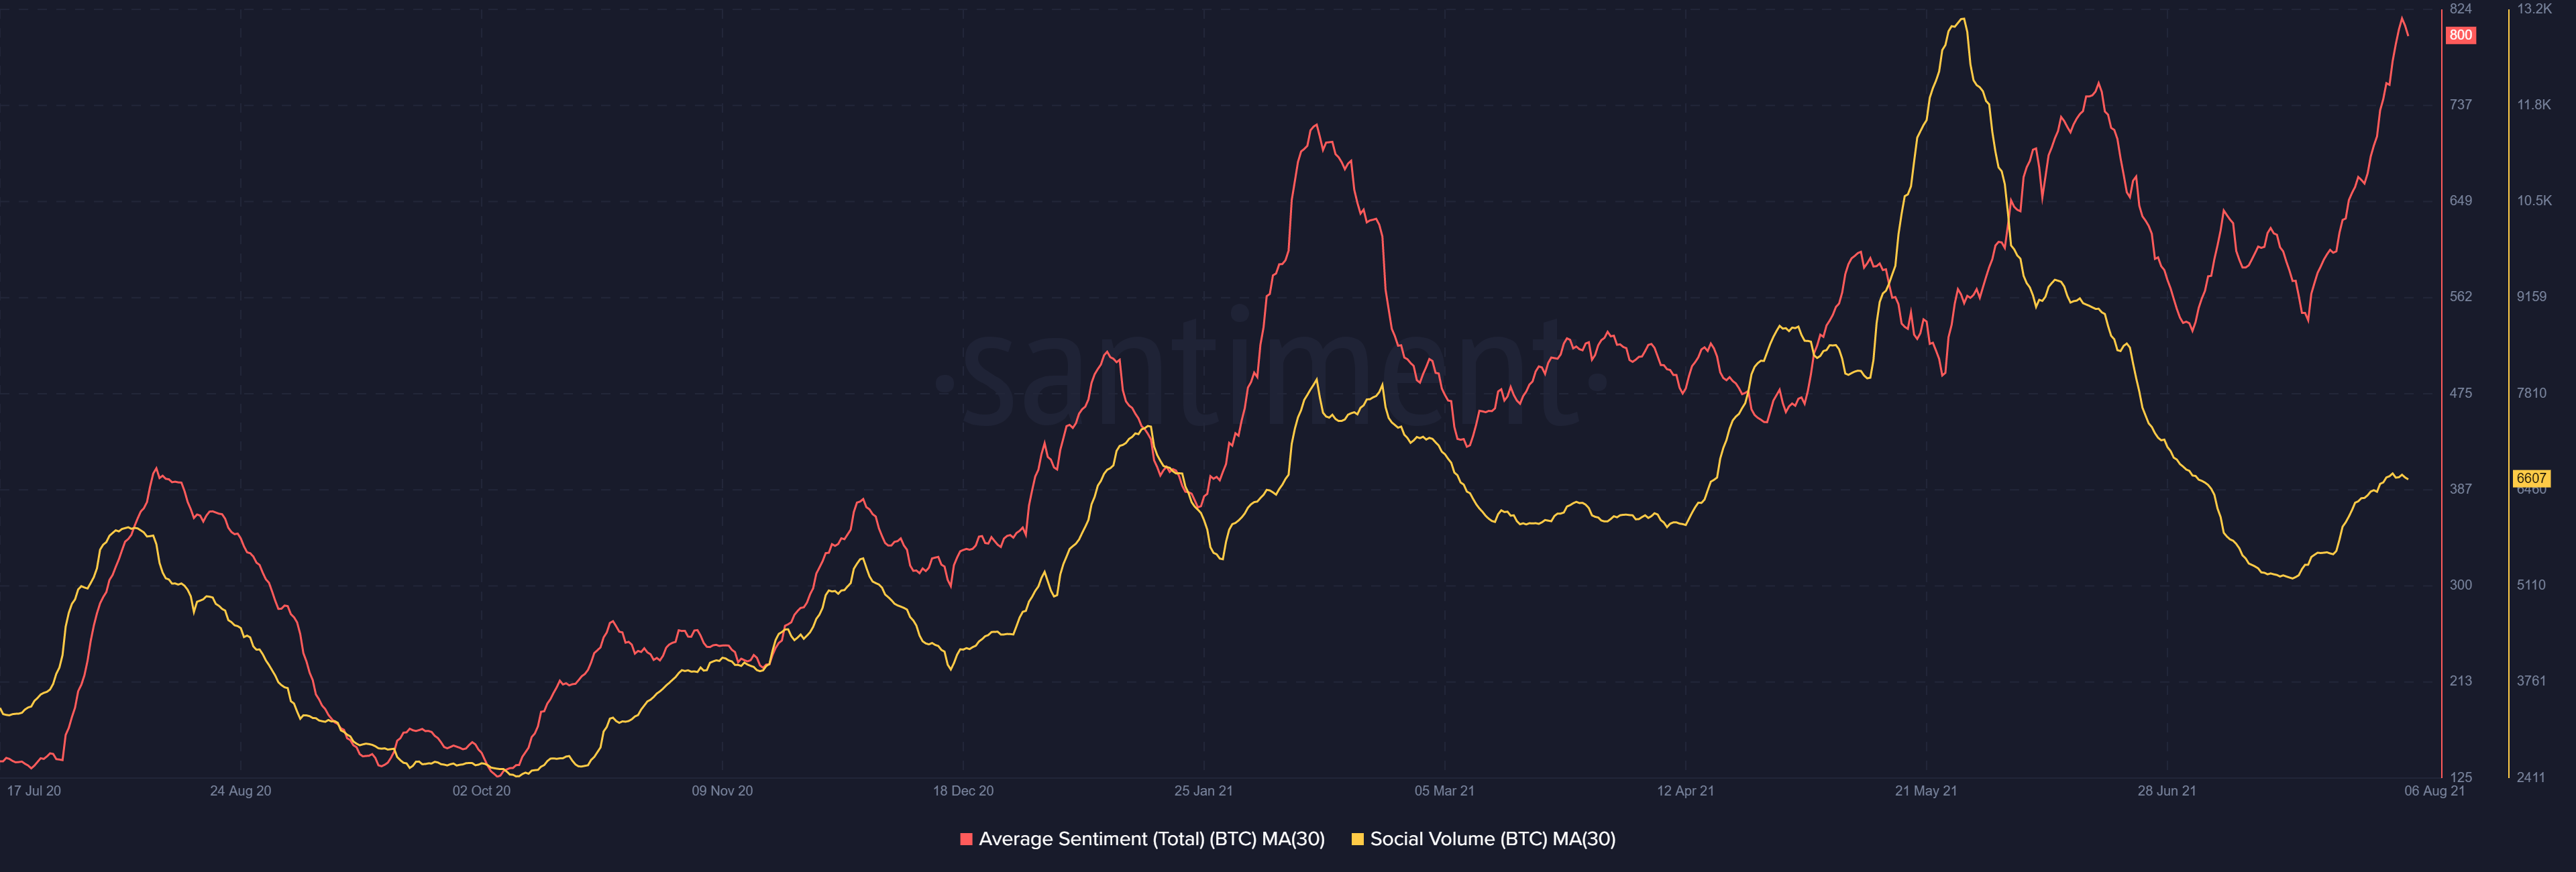
Moreover, the GBTC premium is now improving as well, something that suggests institutional interest is growing too. In fact, it has risen by 9% since May, climbing to -8% at press time. Finally, social volumes and investor sentiment must remain positive to protect Bitcoin from any major bear move.
However, do not hook all your hopes just to the S2F model as it is not a godsend metric and its predictions aren’t absolute. In fact, talking about its accuracy, this is what CryptoQuant CEO Ki Young Ju had to say,
“I think S2F model is flawed in terms of the demand side. This model is based on scarcity and scarcity is about the supply side. That’s why the current BTC price deviates greatly from the price predicted by the S2F model. If PlanB adds some variables to see demand-side factors, the model can be more accurate I think.”


