What can traders expect from this Bitcoin Golden Cross

The Bitcoin Golden Cross is an event that is always much awaited by analysts, traders, and investors alike. Historically, a Golden Cross always brings in a price hike and lifts the market up from the bears’ claws. After the June 23 Death Cross, this Golden Cross holds a lot of value. But the truth of the matter is that this time, it could be disappointing due to various reasons.
An underwhelming Golden Cross?
In simple words, a Golden Cross (GC) occurs when 50 EMA crosses over the 200 EMA and a Death Cross (DC) takes place when the opposite occurs. Usually, a GC happens within 300-500 days from a DC. However, due to prevailing market conditions and an early DC, the next GC was expected to occur within 60-69 days. And it did. Previous analysis placed it within the end of July and the beginning of September.

Now typically GC’s are indications of a price rise. Historically that has been the case almost every time. But this time things are going to be different and the market will experience either a price fall or sideways correction.
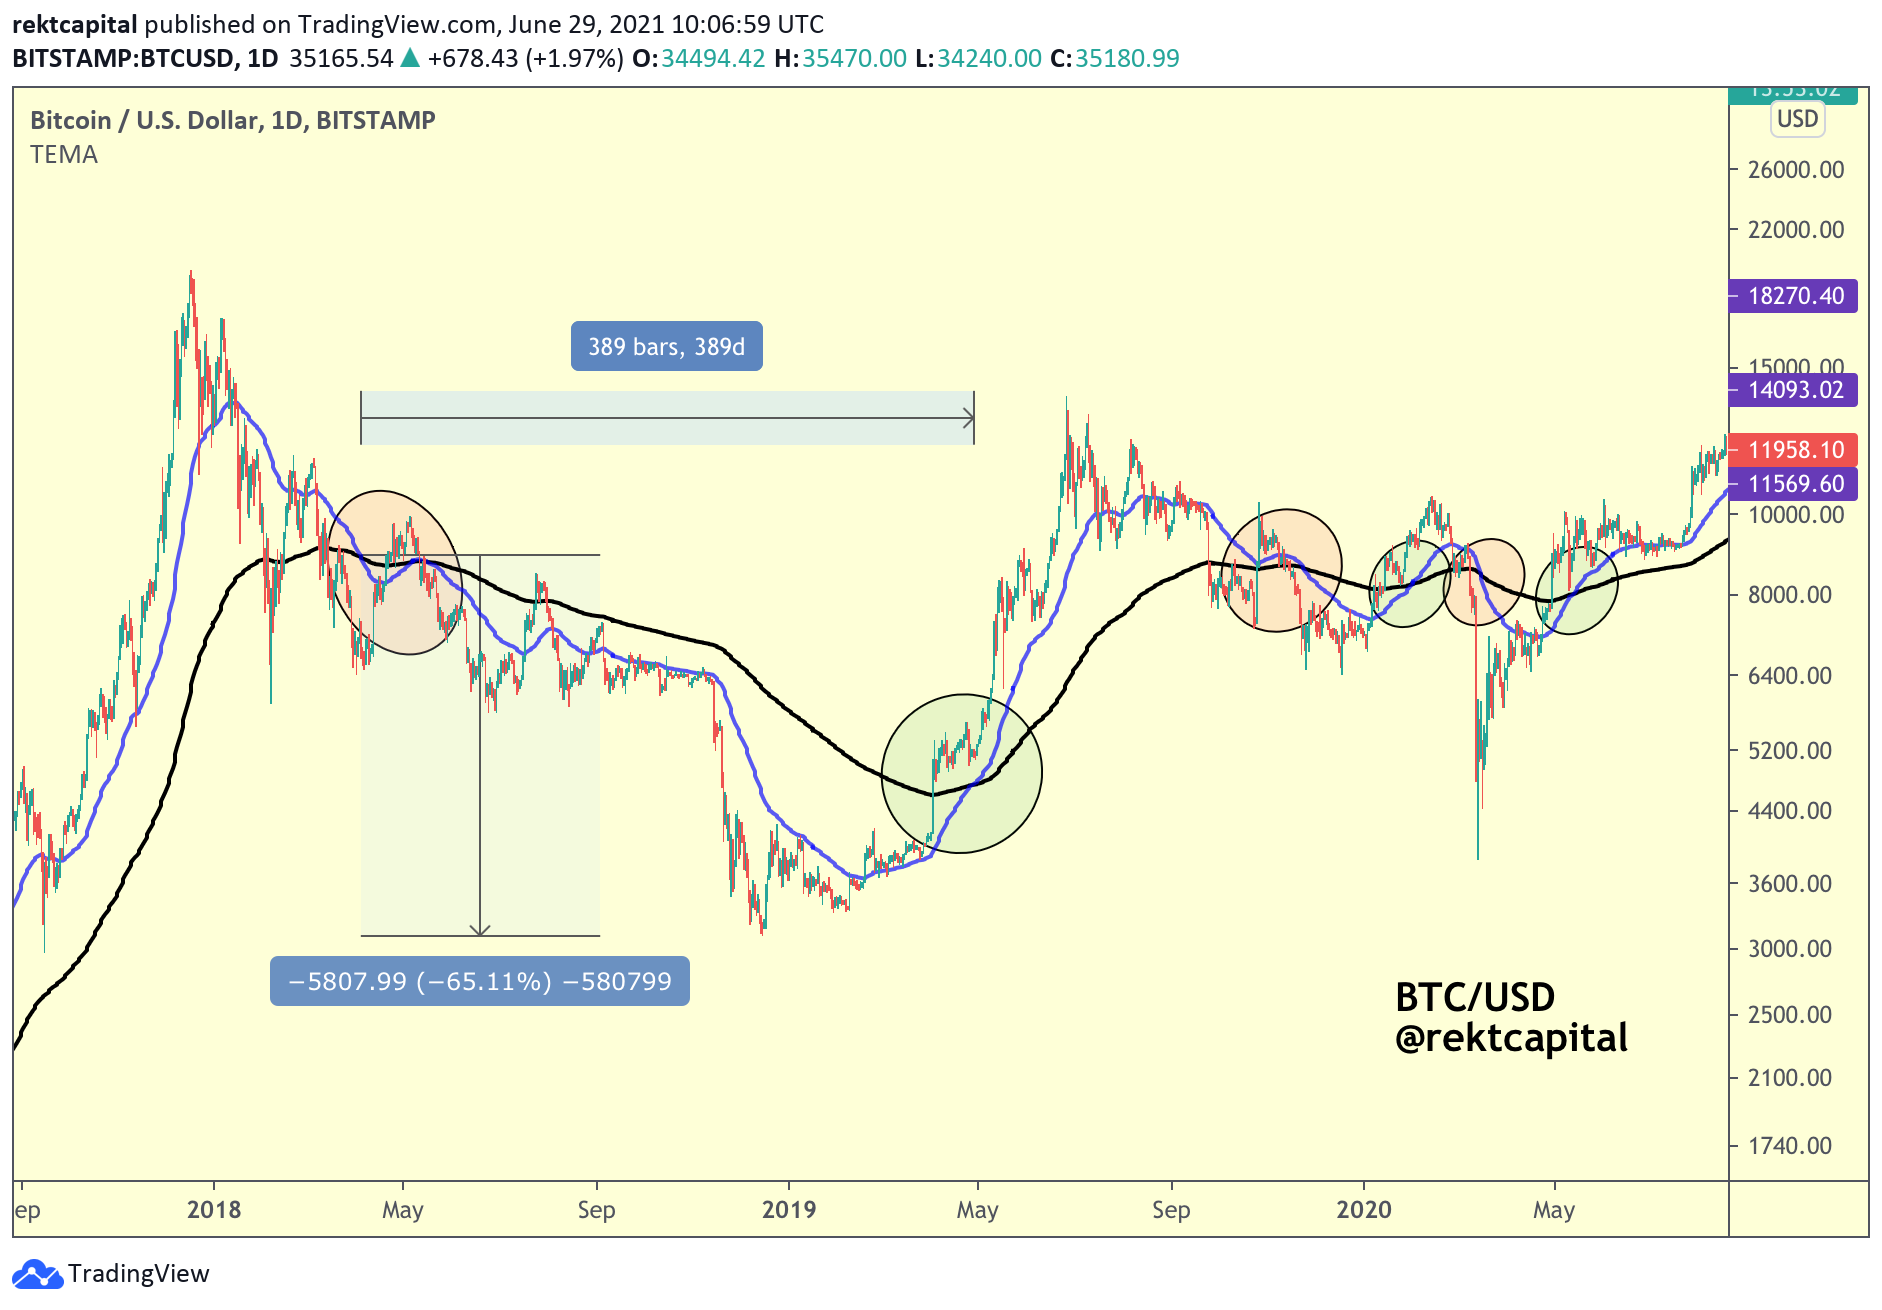
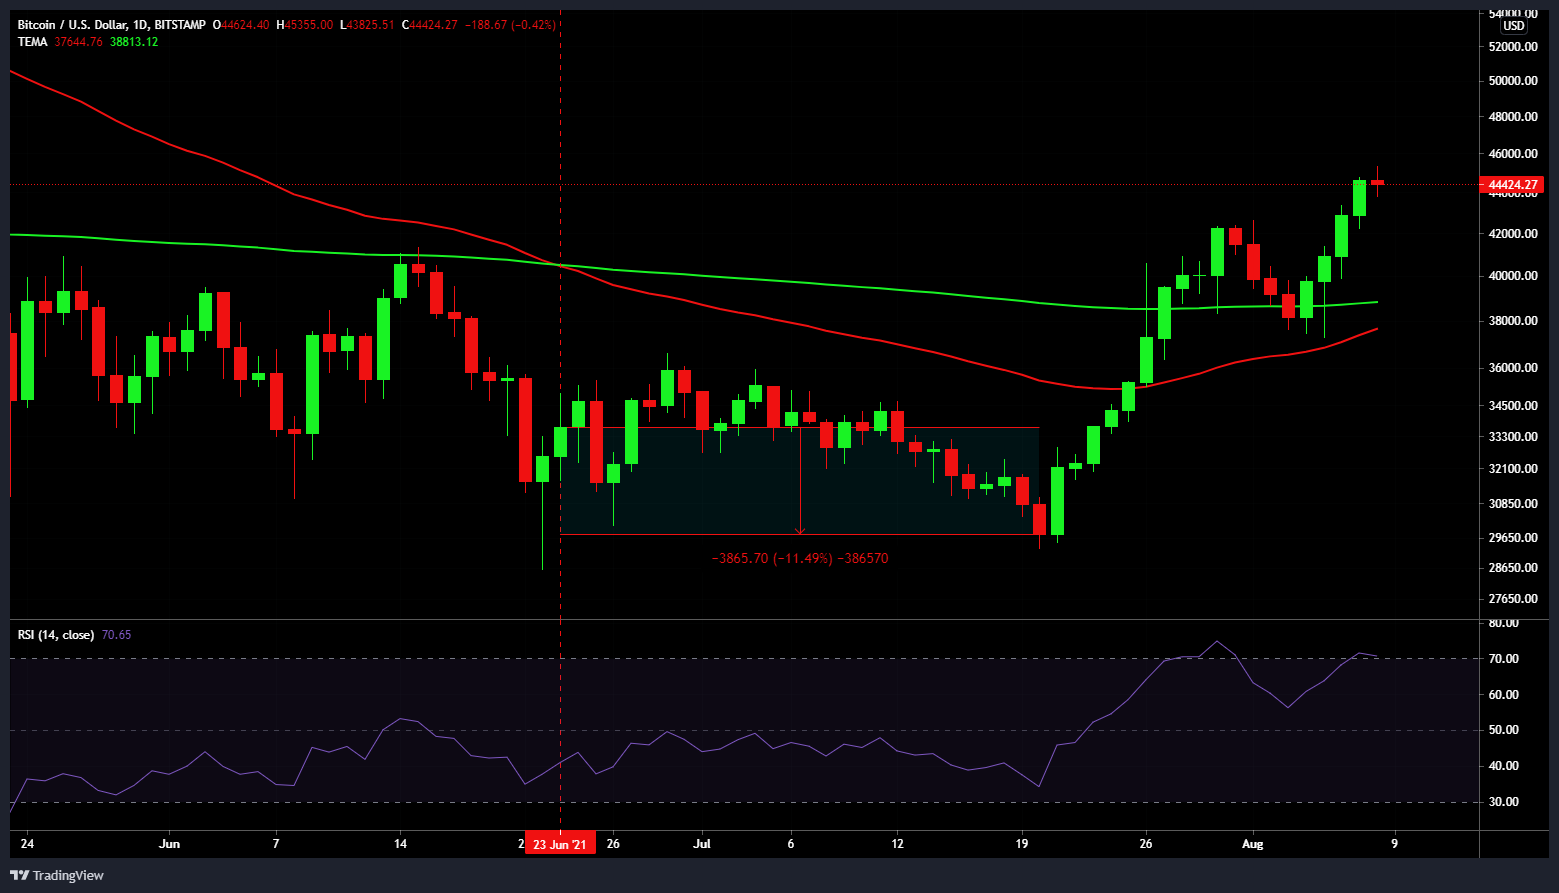
One of the biggest reasons for this is the failed DC of June. Usually, a DC results in significant falls, but this time the lowest BTC reached was -11.5%. Moreover, this DC was one of the shortest yet. At the time of this report, it has been only 46 days and if the GC comes next week, it will still be just 53 days. This is shorter than March 2020’s 57-day long DC. Thus, a failed DC = a failed GC.
What does the data say?
On-chain data supports these extrapolations as metrics show a phase of correction imminent. Looking at Relative Strength Index (RSI), it becomes clear that a trend reversal is forthcoming due to the indicators reach into the overbought zone.
Furthermore, presently the Network Value to Transactions ratio on a 30-day SMA was at a 10-year high. The last time it was this high was back in February 2011. Furthermore, Reserve Risk was at a 2-month high, which showed that due to the high prices, investors’ confidence is low currently.
These are all clear indications that this GC will not likely bring a tremendous price rise. At best, a sideways movement should be expected.


