What Cardano traders can expect before the asset gets close to its ATH

Ever since the third week of April, Cardano has seen its price move southward, maintaining a steady downtrend. Since then, ADA lost over 34 percent of its trading value falling from $1.5 to $0.98. However, in the past day, a strong trend reversal has finally taken place enabling ADA to surge by over 7 percent in a 1-day time frame. This also raises the question of whether further price action for the world’s 6th largest cryptocurrency is purely smooth sailing or whether it is susceptible to yet another price correction before it gets close to the ATH.
While Cardano’s 24-hour growth has been promising, it is also soon coming in contact with a key price range. The $1.28 to $1.38 price level is and has been a substantial resistance level for ADA in the past few months. Since 27 February, ADA has, on countless occasions, tried to breach this level and in most cases did not manage it. During times when it did go past, the market was subject to short-term price corrections.
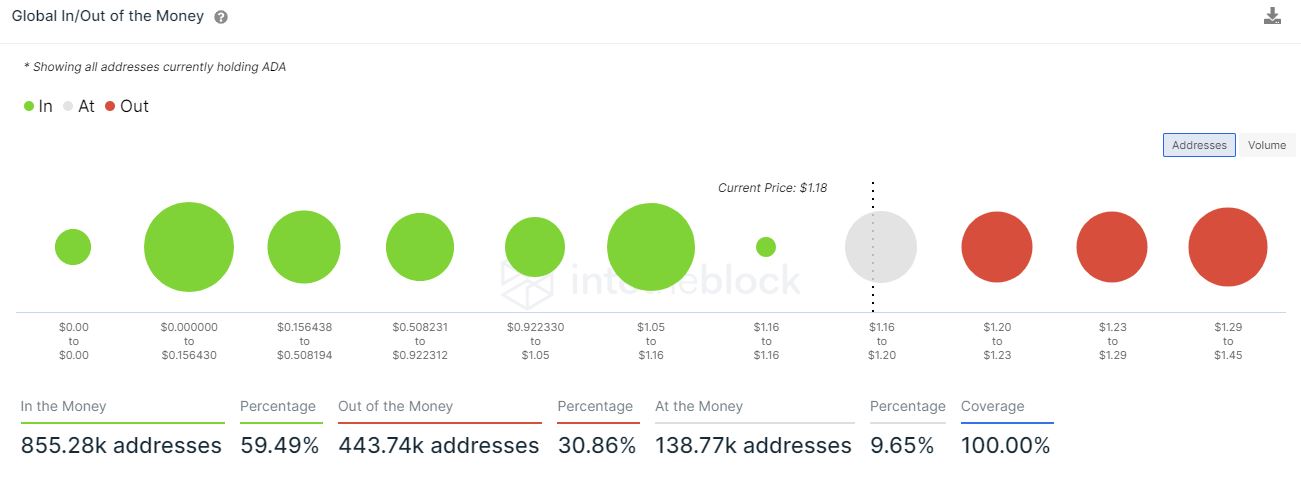
Interestingly, data provided by IntoTheBlock highlighted that in between the $1.2 and $1.4 price level, there are around 443.74k addresses that are current Out of the Money. If one were to take a look a the current price of ADA, it can also be noted that there only 11.80% of all addresses are currently breaking even. However, there is a whopping 25.42% of all addresses currently in loss given the present market condition.

The high correlation ADA shares with Bitcoin is also not helping ADA’s bullish case. While it is currently surging on the charts, minor corrections in the BTC market tend to be amplified with regard to ADA’s price action. According to market data, ADA’s correlation rose from – 0.21 percent to around 0.83 percent at press time and this could once again prove to be a pain point for ADA’s long-term price aspirations.
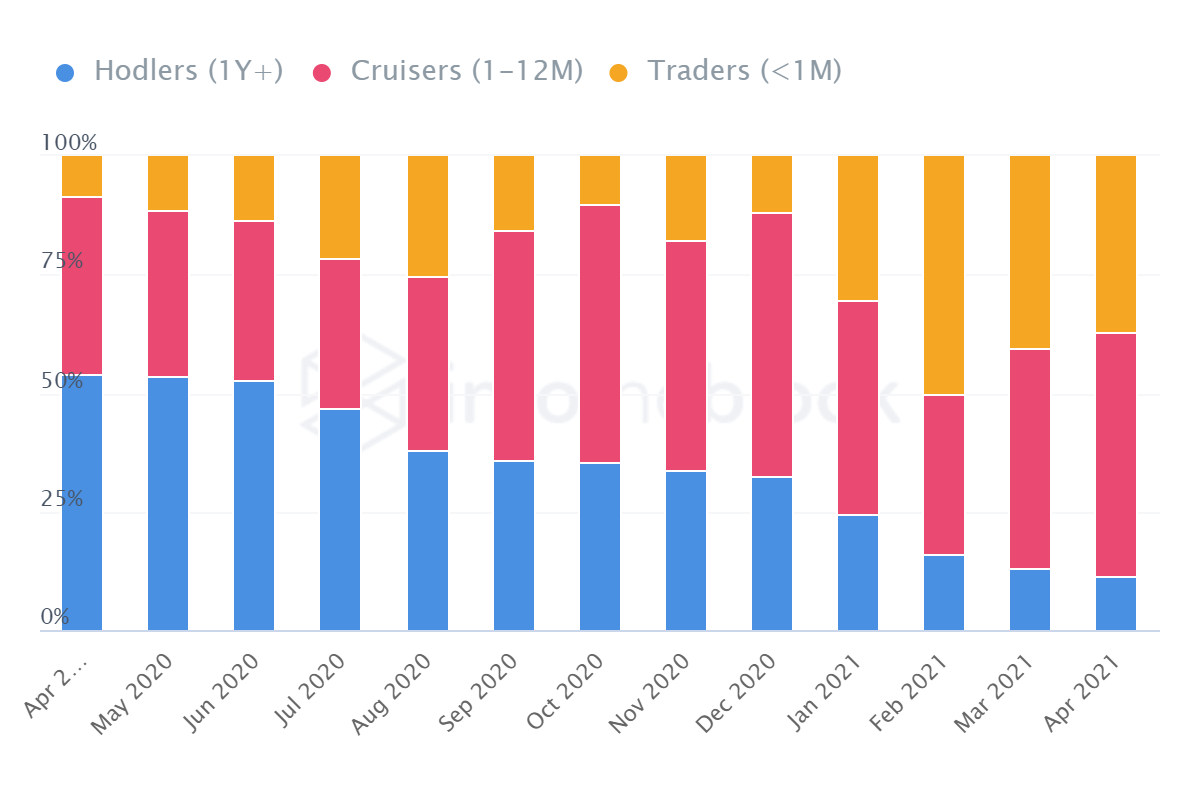
For many altcoins including ETH, the past few months have seen an increased presence of long-term hodlers. However, the inverse seems to be true for ADA.
According to data, ever since the start of the year, there has been a drastic rise in short-term traders as opposed to long-term hodlers. At the moment, IntoTheBlock highlighted that traders who on average hold on to their ADA assets for less than a year are dominating the market. There are around 535.32k addresses who are short-term traders that amount to around 37.23 percentage of total addresses while long-term hodlers are a minority with just 11.33 percentage.
The fact that the ADA market is dominated by traders who are keen on short-term trades, makes the $1.28 – $1.38 price range quite important. As the price increases, if a significant portion of short-term traders enters the seller’s market, then ADA may once again have to deal with yet another price correction before bouncing back towards the $1.5 price level in the coming week.


