Will CRV’s flat price action witness some bumps after Curve Finance’s impressive…

- Curve Finance witnessed steady weekly growth in the last month of 2022.
- Curve’s TVL, however, did not witness the same uptick as CRV also struggled to stay balanced.
The price movement of Curve Finance [CRV] remained unchanged for the latter portion of December 2022. CRV didn’t particularly shine on the price charts as of 2022. However, the platform had a consistent growth in terms of volume right until the end of the year 2022.
What could be the most likely causes for this consistent growth, and how might this affect CRV?
Read Curve Finance’s [CRV] Price Prediction 2023-24
Upward volume Curve
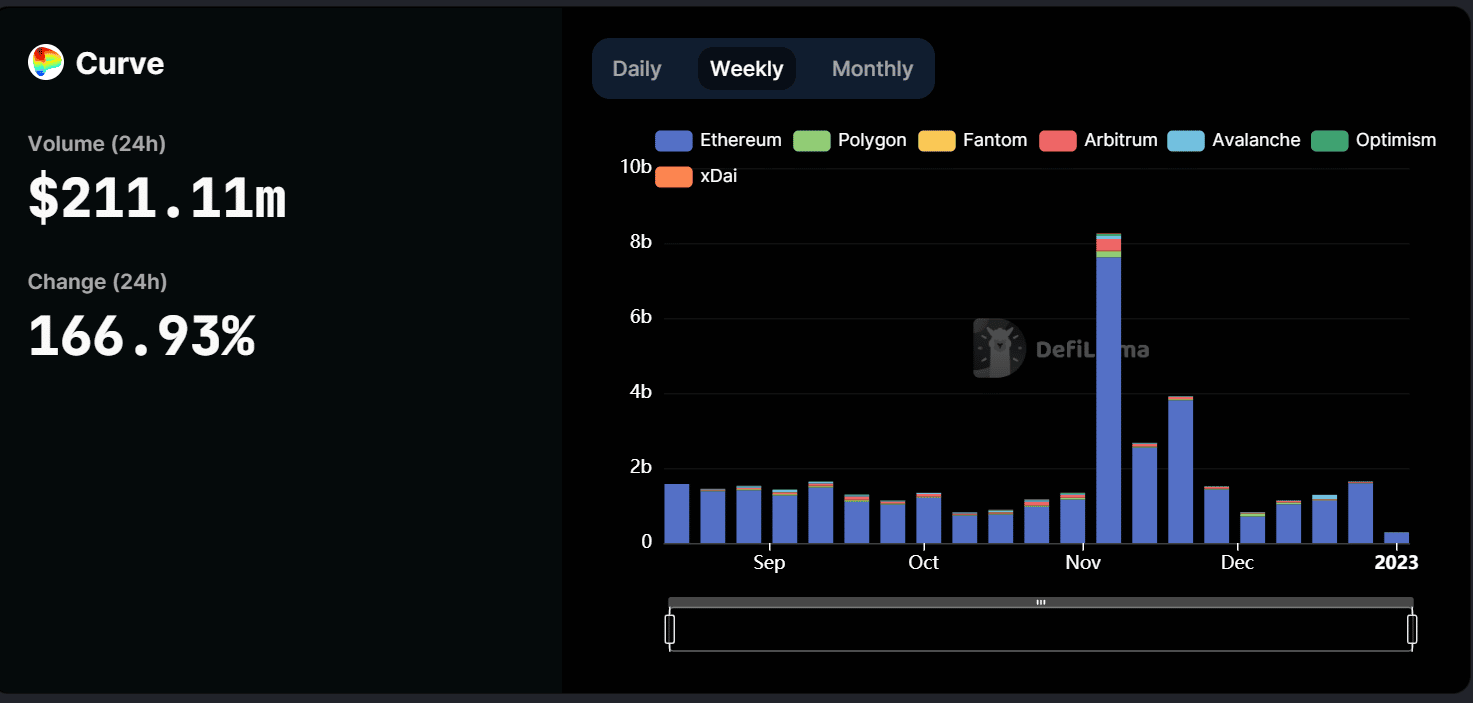
Curve Finance’s volume behavior, notably towards the end of the year, was illuminated as per data from DefiLlama.
Curve volume increased every week in December, even during the holidays. Last week, Curve had higher volume than any week in October. pic.twitter.com/7QI3HQ9ZIf
— Patrick | Dynamo DeFi (@Dynamo_Patrick) January 3, 2023
This chart was useful because December and January are typically slow periods for the markets. Because of this, when the volume shift on Curve was analyzed, it was much more astounding.
A glance at the volume graph for the month of December 2022 revealed that the weekly volume on Curve rose during the entire month. This meant that in the last month of 2022, the platform saw a rise in weekly transaction volume.
From what could be seen on the graph, November was a busier month for the platform than December. The number of transactions in December was up consistently, with Ethereum [ETH] at the forefront.
A spike in Curve’s platform volume may be attributable, at least in part, to the widespread fear, uncertainty, and doubt (FUD) surrounding centralized exchanges after the FTX collapse.
The higher levels of engagement with Decentralized Finance (DeFi) platforms shown during the collapse suggest the level of long-term engagement that the area and Curve are capable of attracting.
TVL not so positive
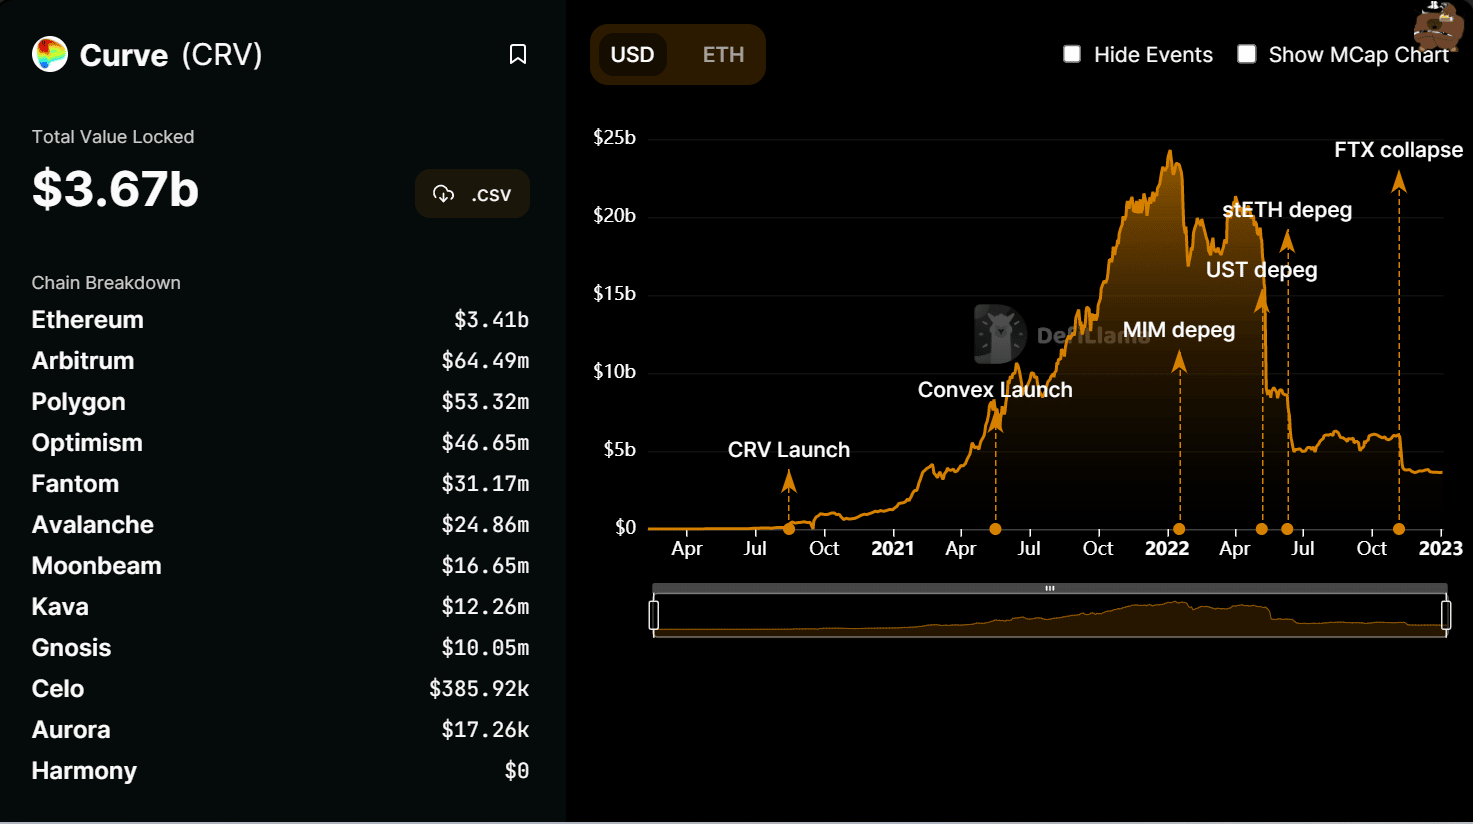
On the Total Value Locked (TVL) chart, it was possible to see that Curve’s TVL experienced the opposite impact of the FTX collapse compared to the volume. The slump caused its TVL to go below the $5 billion range it was in and, as of the time of this writing, was estimated to be around $3.67 billion.
Despite a significant increase in volume, the TVL was badly impacted, and the charted data showed no signs of recovery yet.
Are your CRV holdings flashing green? Check the Profit Calculator
CRV remains flat in a daily timeframe
After falling by about 18% in December, CRV’s price movement has generally been sideways, or practically flat. However, one benefit of the price movement was the opportunity to create a support level between $0.51 and $0.48. The token was trading at about $0.55 at the time of this writing, with a 5% rise seen throughout the same trading period.
Despite the excellent volume on the Curve platform, the price of CRV was not favorably impacted at the end of the year, according to the price movement seen over a daily period. However, as more volumes are recorded, this could alter.

