XRP Price Analysis: 26 March

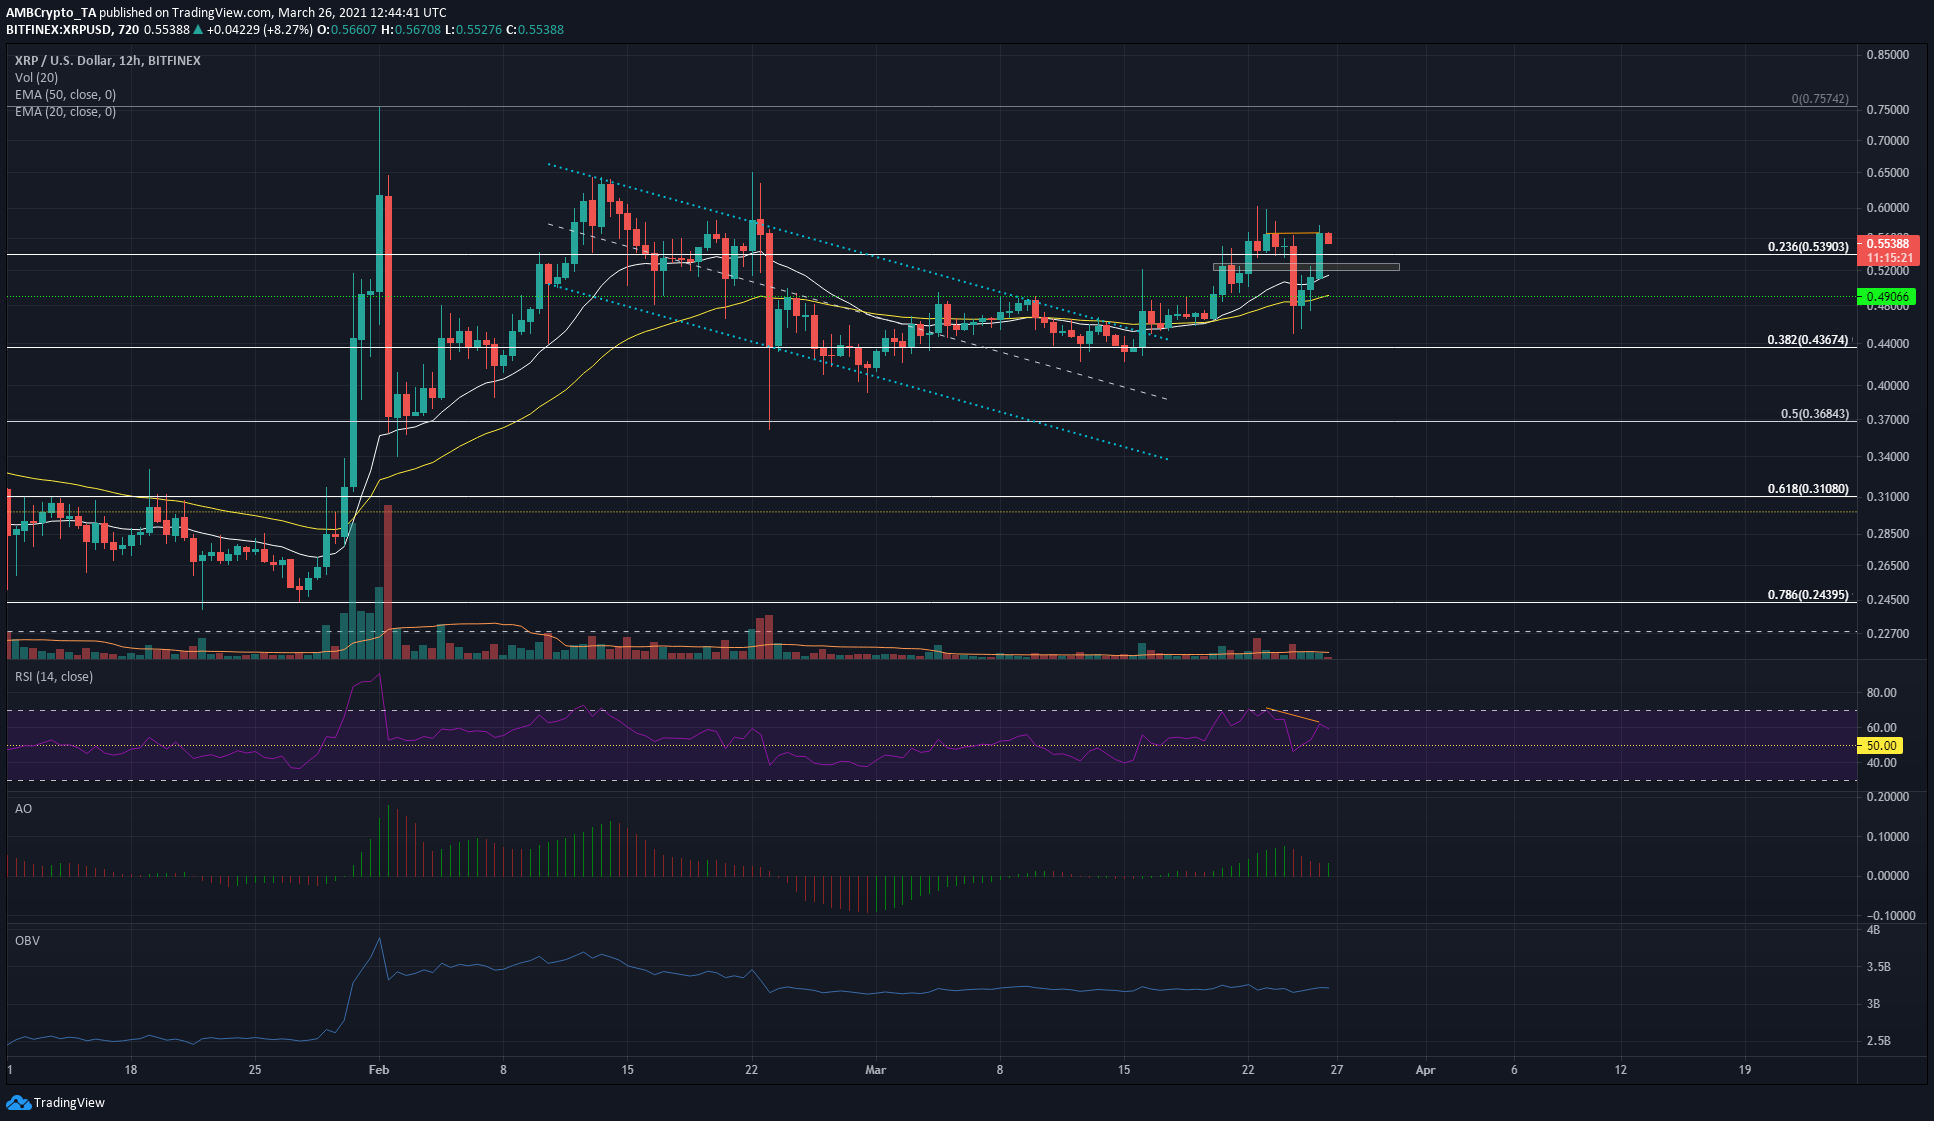
XRP whales were in accumulation mode, concluded experts upon analysis of XRP on-chain data. Data from Santiment highlighted that XRP has been a steady presence on their emerging trend page. With regard to the SEC lawsuit with Ripple, courts compelled SEC to produce documents with regard to Bitcoin and Ethereum concerning their status as non-securities. On the charts, XRP could see a dip to $0.539 before moving to $0.63 and possibly higher.
XRP 12-hour chart

Source: XRP/USD on TradingView
In the long-term outlook, XRP broke out of a descending channel and was headed back toward the $0.63 mark, the peak of the channel. Momentum had shifted in favor of the bulls since flipping the $0.49 level to support, but there was not a significant buying volume seen.
The $0.52 and $0.63 levels are of interest, and so is the trading volume for each session. A surge in volume would be the clearest indication of a strong, imminent move for XRP. A long position entered in the $0.52-$0.54 area could be profitable in the coming weeks.
Reasoning
20-period EMA (white) was moving above 50-period EMA (yellow), showing bullish momentum behind XRP. The 50 EMA had also served as support in the past two weeks.
RSI showed an exaggerated bearish divergence as the price made equal highs at $0.566 while RSI made lower highs, and this could see XRP pullback to $0.539, a retest of the 23.6% retracement level as support. Apart from this, RSI stayed above neutral 50 since breaking out of the channel, denoting upward momentum.
Awesome Oscillator was moving above the zero line, showing momentum was in favor of the bulls.
OBV was in the same area it was in late February, showing that since then there has not been a major shift in the equilibrium between buyers and sellers. In fact, since the drop from $0.63, significant buying volume was yet to step in, showing a lack of bullish market conviction.
Conclusion
A minor dip can be seen but momentum was behind the bulls for XRP and a move to $0.62 can be seen in the coming week.


