XRP, Solana, OMG Price Analysis: 10 November

During the recent bull run, XRP hit its nine-week high, OMG attained its 3.5-year high, whereas Solana hit its ATH. However, the current price action for all the above cryptocurrencies saw a retracement as near-term technicals preferred the sellers. Nevertheless, Solana technicals hinted at a possible revival from the correction phase.
XRP
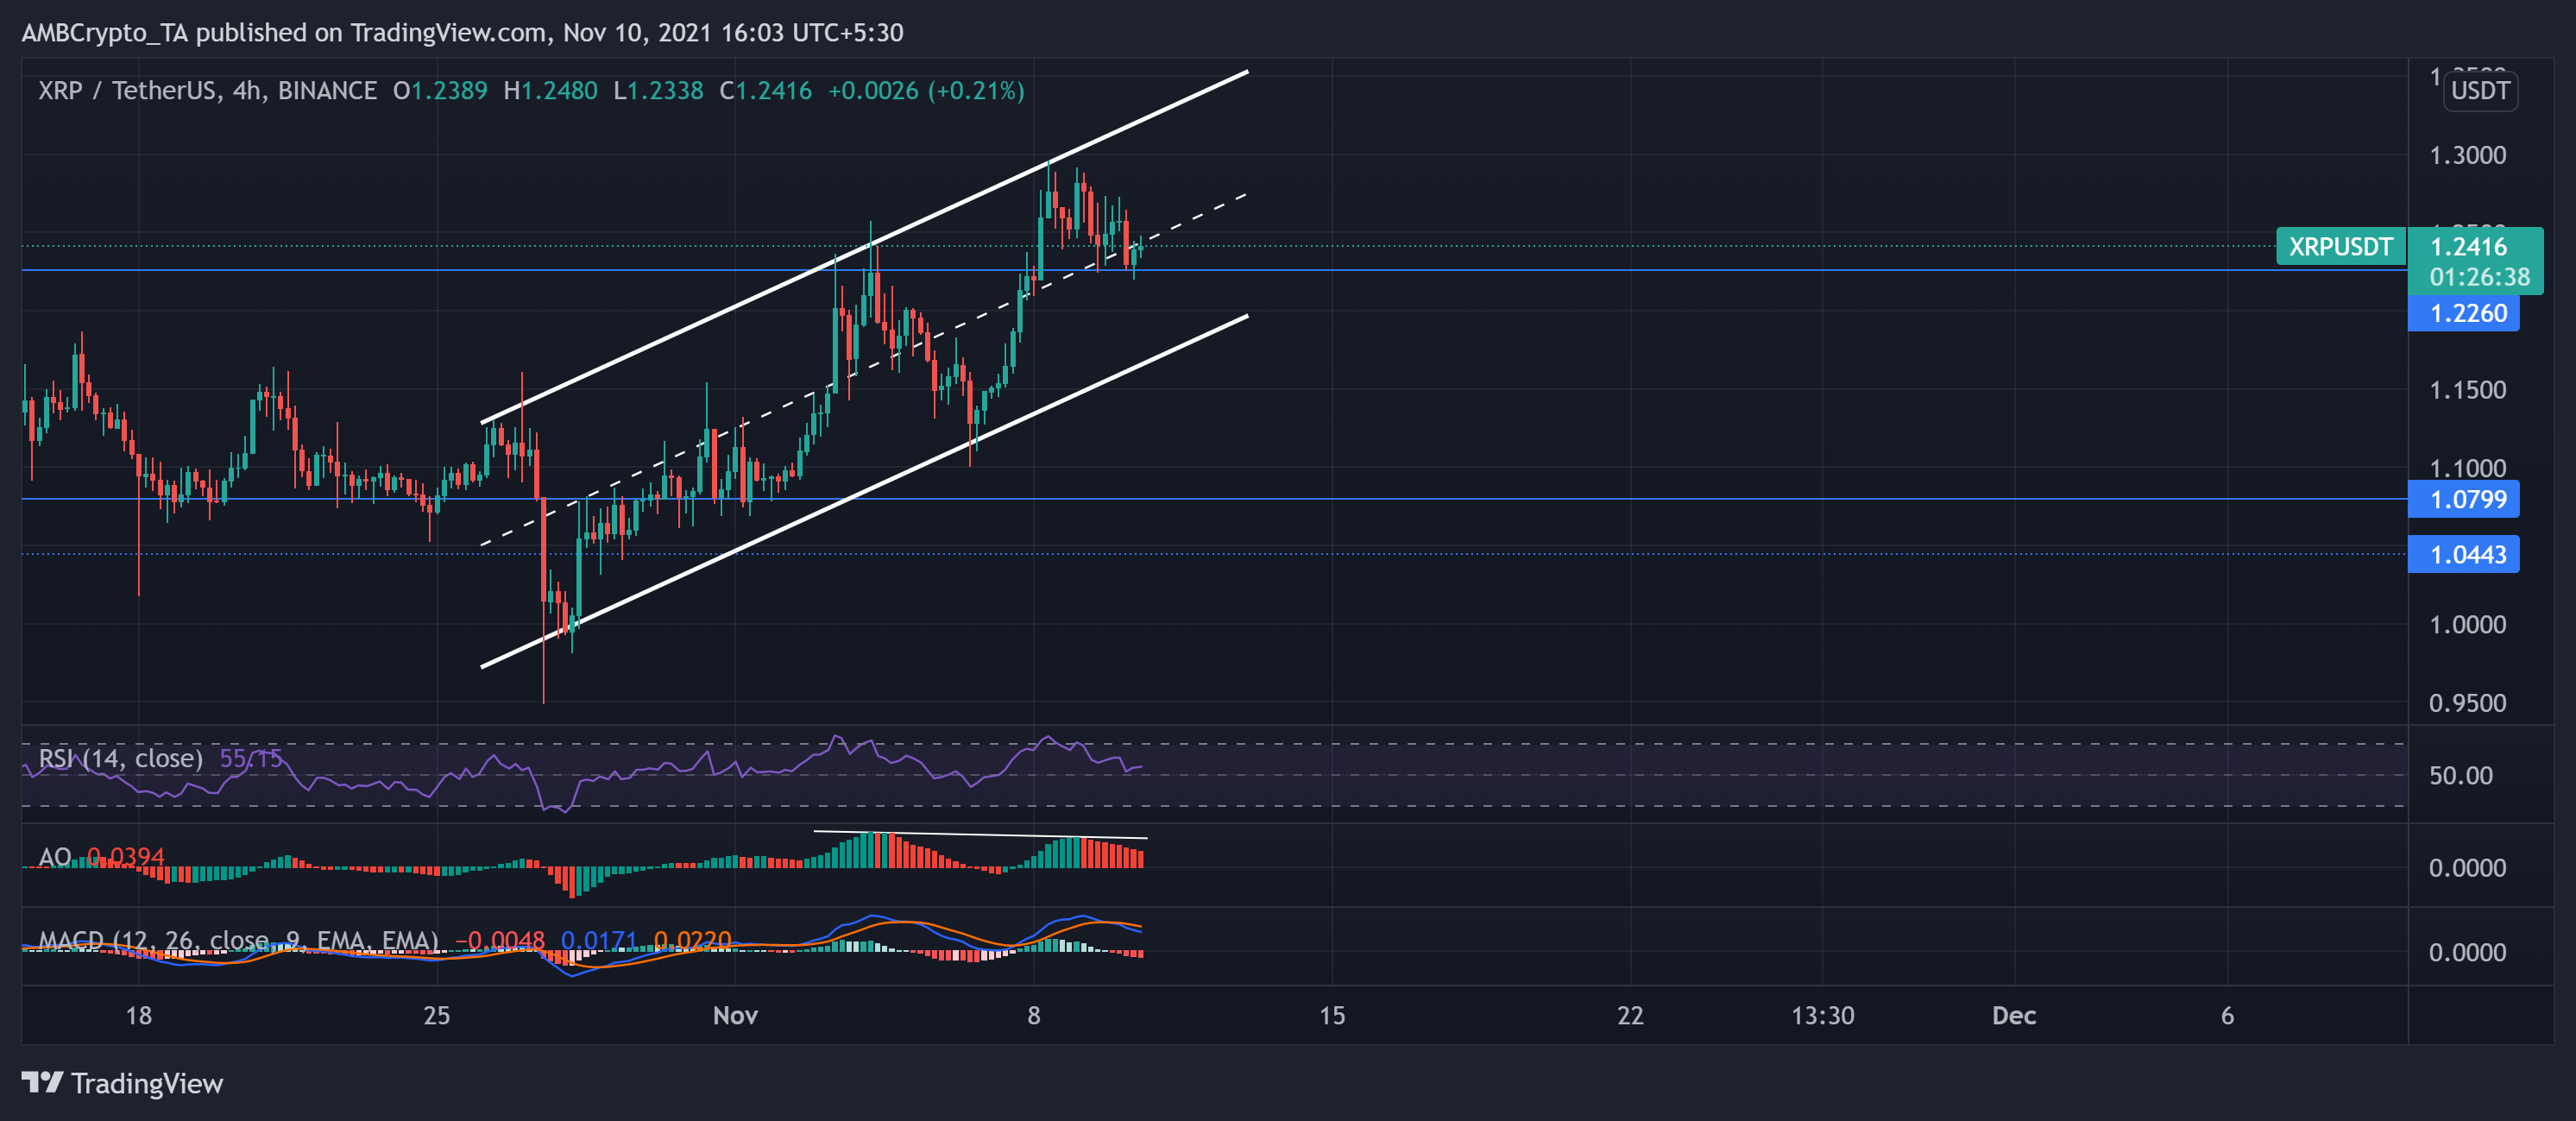
After slipping to its four-week low on 27 October, XRP bulls took over and exerted sustained pressure. As a result, XRP formed an ascending parallel channel for over two weeks after noting a 12.1% 14-day ROI.
The price rallied to crack its immediate resistance at $1.2260 and touched its nine-week high on 8 November. However, it saw a withdrawal and bounced back between the parallel lines following the trend. Since then, XRP bears countered the bulls’ pressure as the near-term technicals hinted at decreasing buying strength. At press time, XRP traded at $1.2416 after noting a loss of 1.89% over the last day.
The Relative Strength Index (RSI) declined by 15 points after assuming a downtrend, indicating a notable decrease in bullish influence. Also, the Awesome Oscillator (AO)’s second peak was lower than the first, reaffirming increasing selling strength in the near term. Furthermore, the bearish readings on MACD resembled previous observations.
Solana (SOL)
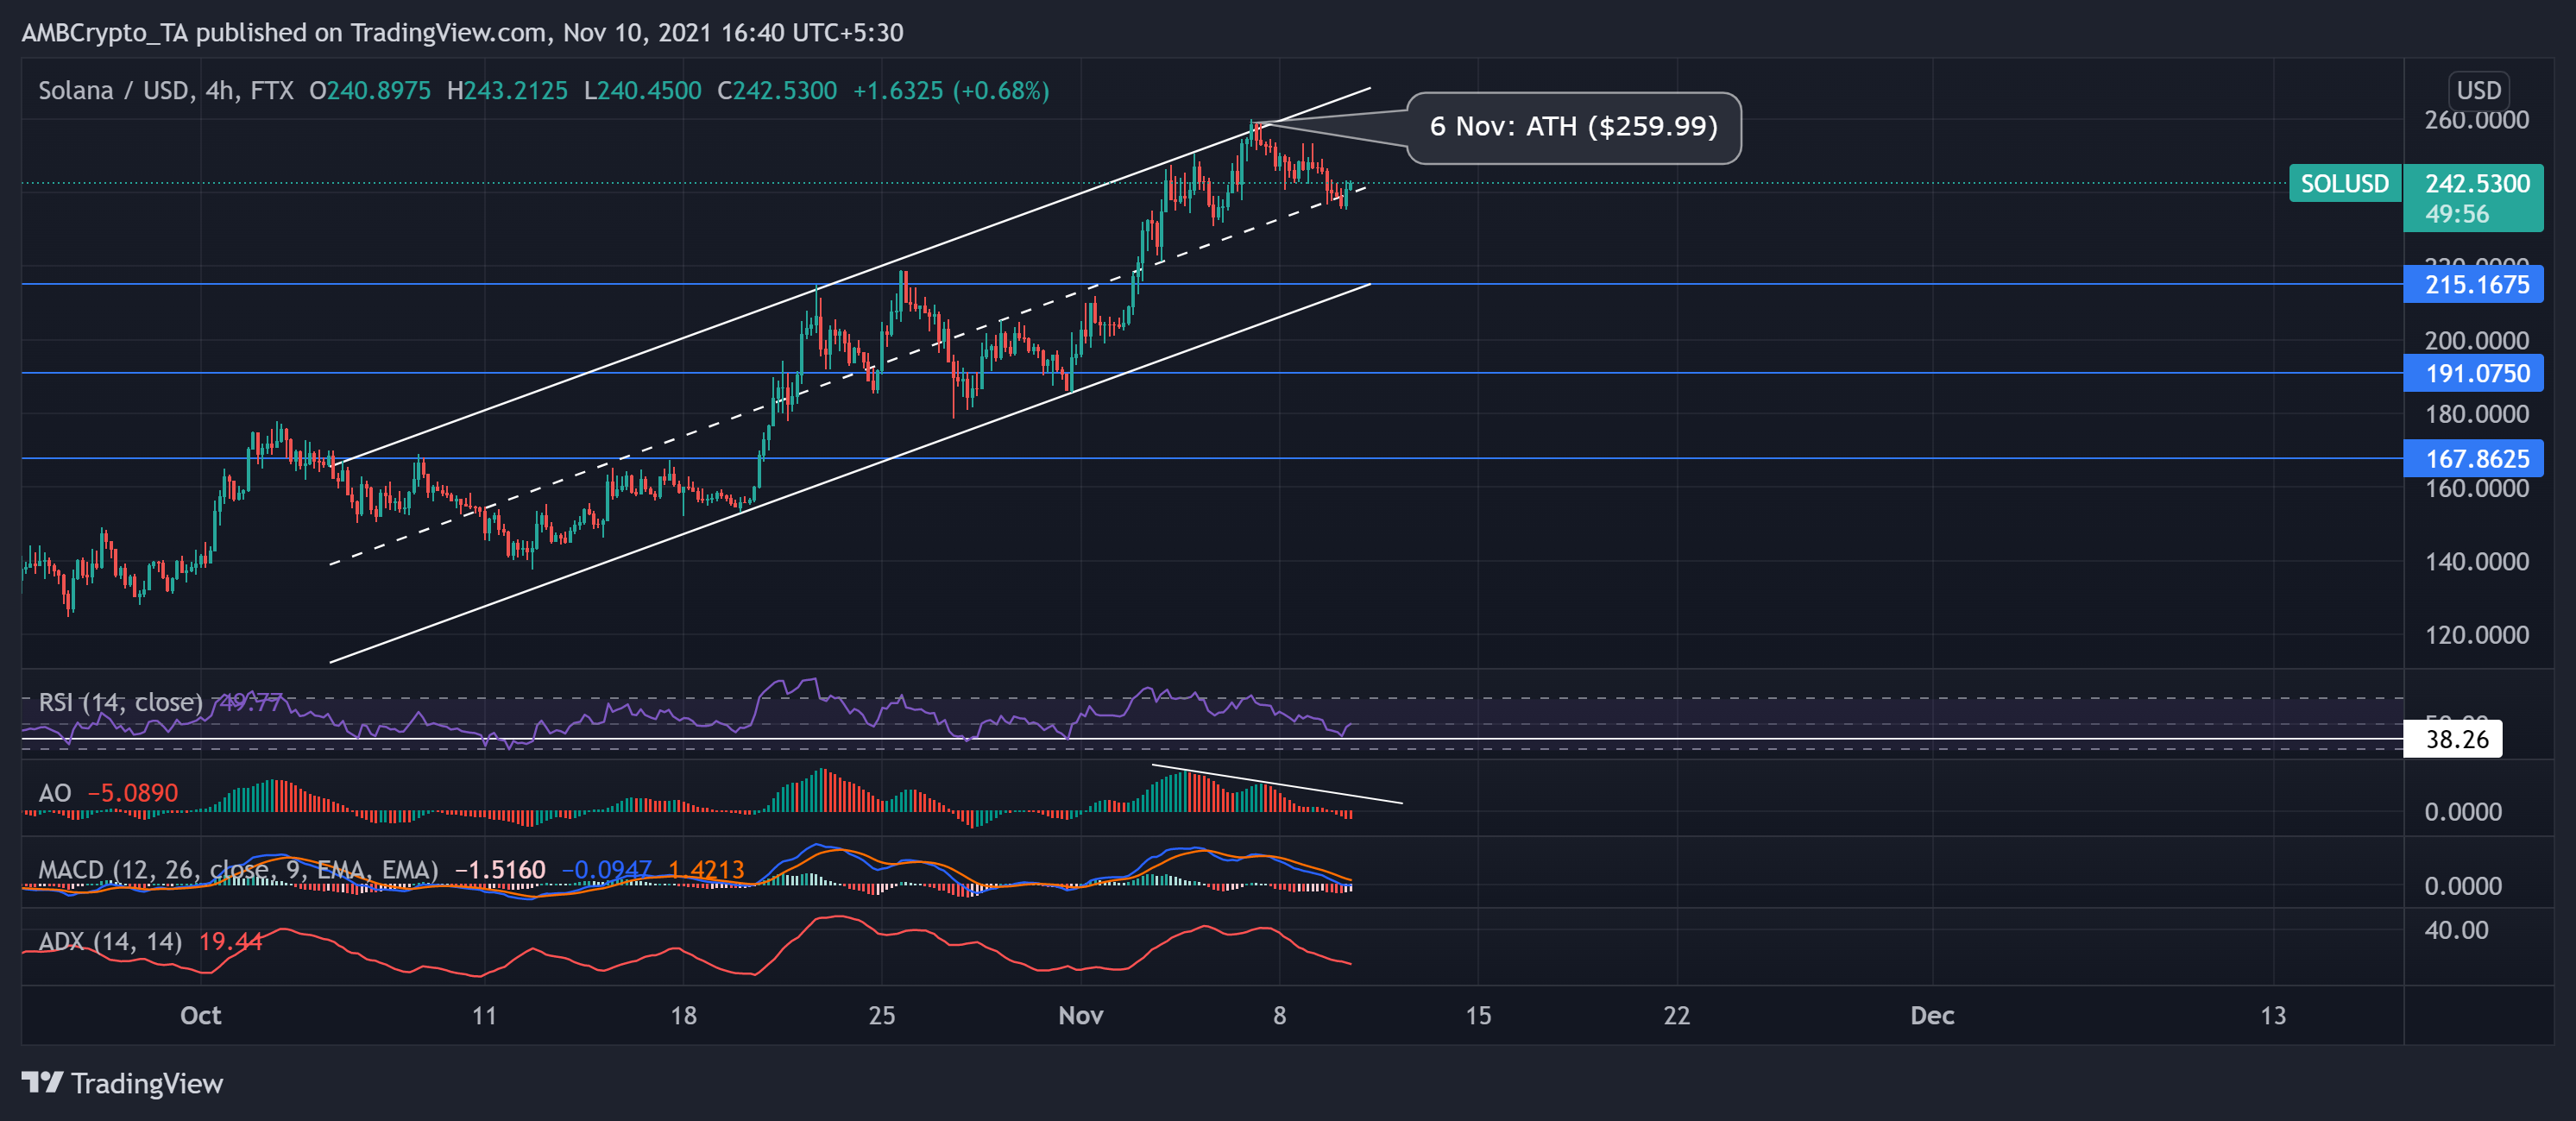
Over the past five weeks, SOL undertook a bullish trajectory and oscillated between the parallel channels. The potential long-term rival for Ethereum recorded 64.6% and 10.2% monthly and weekly ROI, respectively. Consequently, the price action marked higher highs and broke the upper trendline to strike its ATH at $259.995.
Subsequently, SOL witnessed a pullback as the price stepped back into trend and could not breach the upper trendline. At press time, SOL was in a retraction phase and traded at $242.53.
Over the past day, RSI dipped from the half-line to the 40-mark. This plunge notably depicted increasing bearish momentum. However, RSI showed signs of revival as it backtracked toward the midline.
Additionally, MACD and the AO histograms favored the sellers but also resonated with possibility of RSI reviving. Moreover, the ADX line displayed a weak directional trend.
OMG Network (OMG)
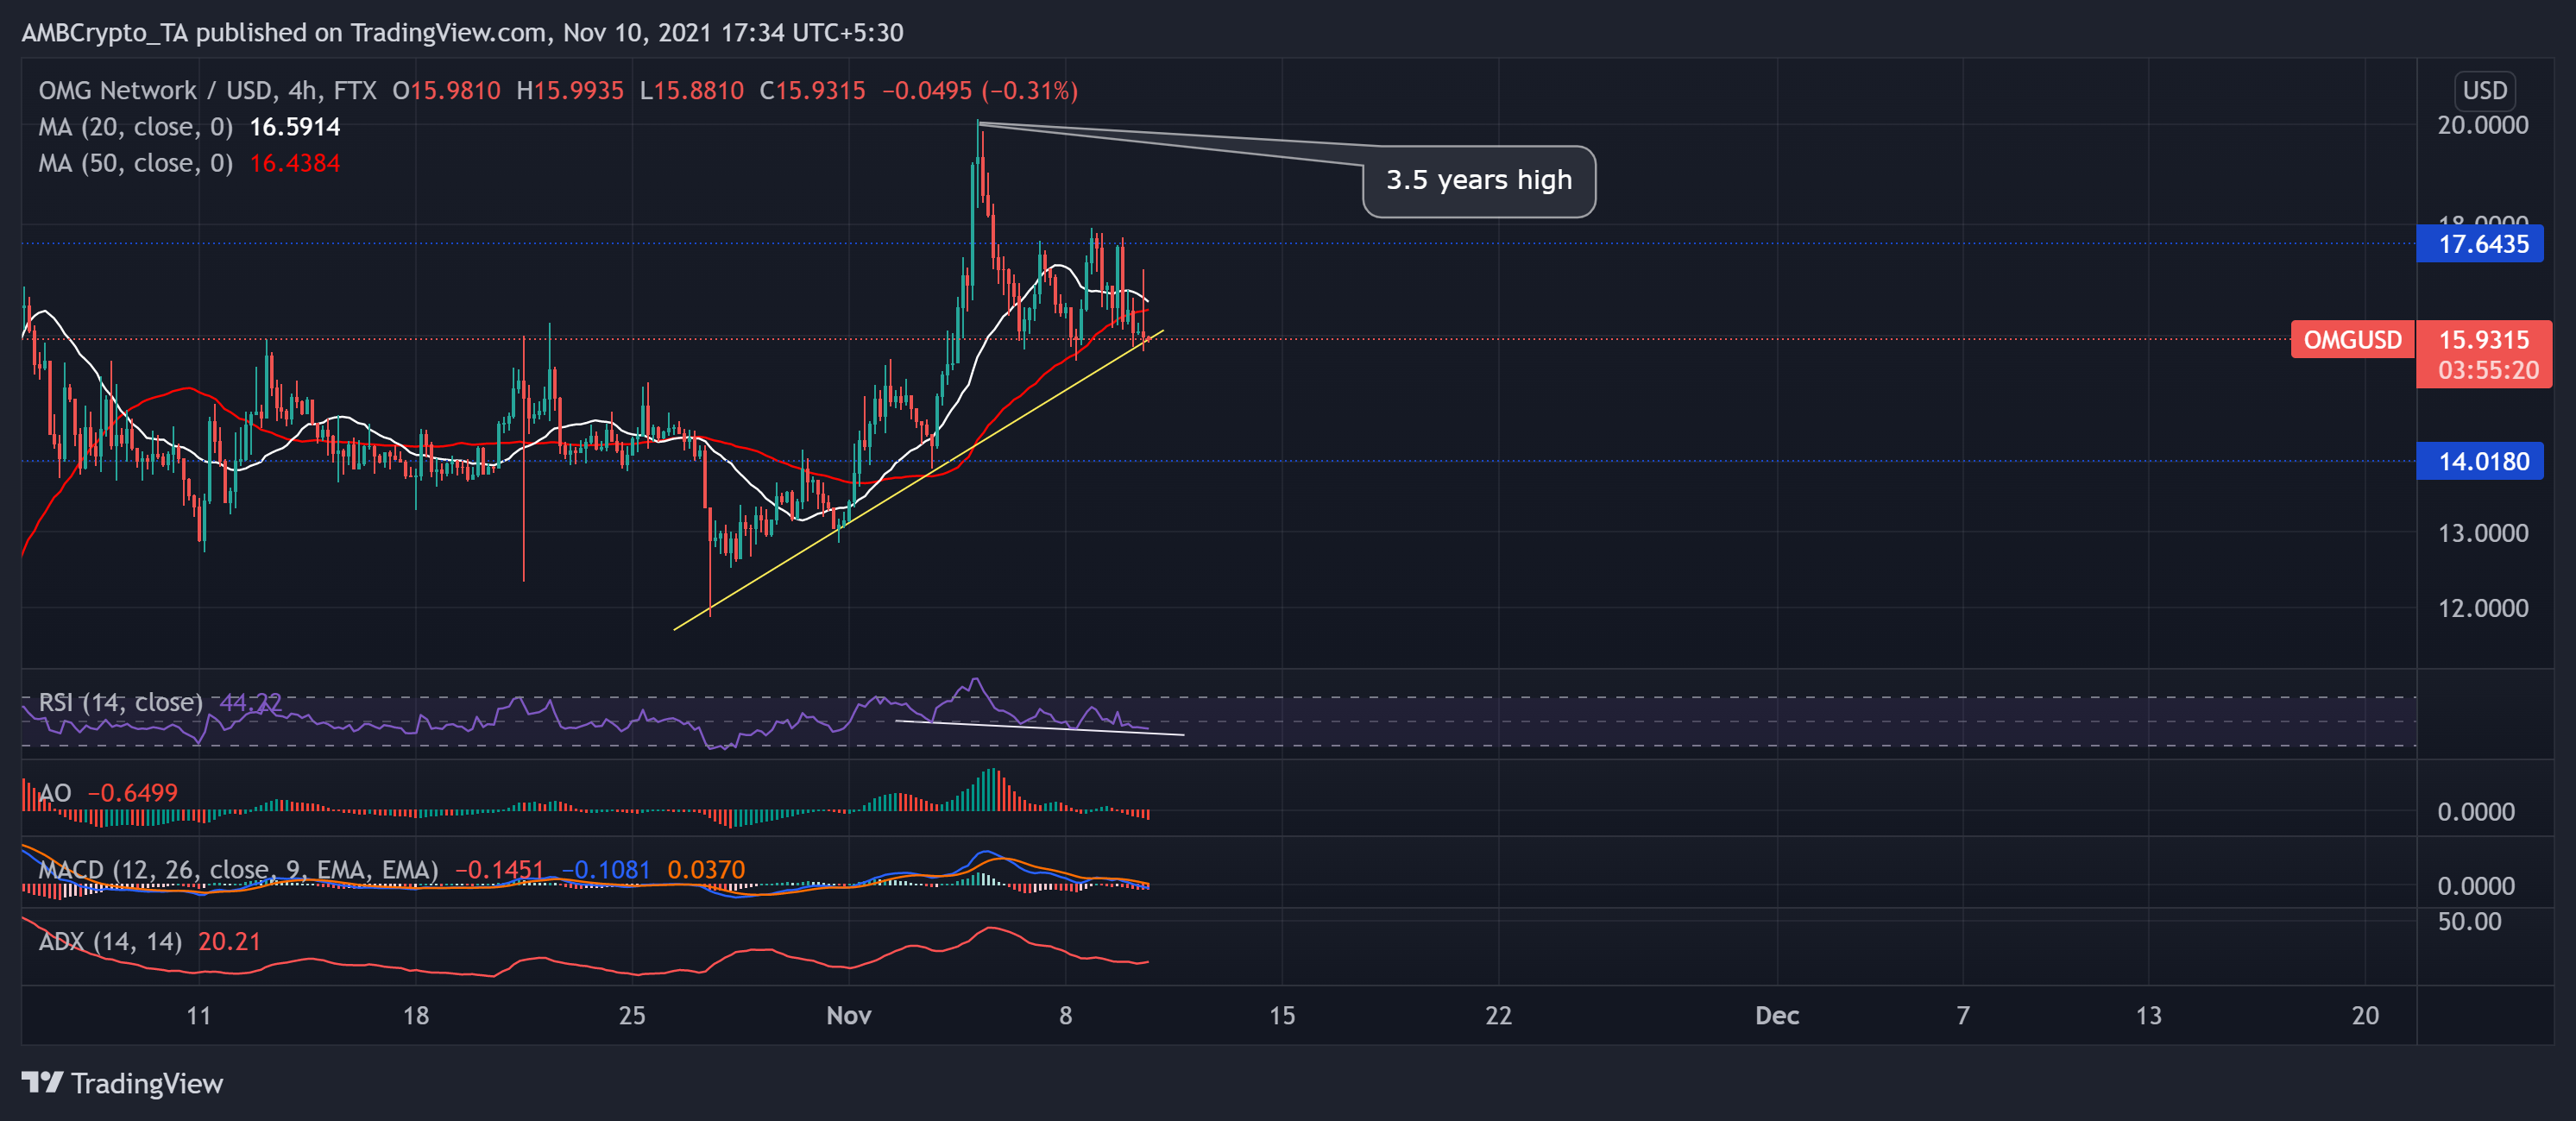
OMG network’s native token rallied by over 67% from 27 October to reach its 3.5 year-high on 6 November. The digital currency noted a 24.5% and 9.11% monthly and weekly ROI, respectively.
However, the altcoin saw a 2.93% decline in 24 hours as technicals hinted at increasing selling strength in the near term. At press time, OMG traded at $15.9315. The bears countered the buyers as the price action retreated between its immediate resistance and support points.
The RSI plunged by 14 points and headed below the midline, depicting increasing selling strength in the near term. Additionally, AO and MACD flashed red signals and reaffirmed the previous readings. However, the ADX line displayed a weak directional trend.