XRP, Tron, Aave Price Analysis: 02 August

As the market’s bulls lost momentum, the likes of XRP, TRX, and AAVE saw their prices stall on the charts. XRP struggled to break its immediate resistance level while a 2.2% decline was responsible for Tron’s uptrend pausing. Finally, AAVE’s demand had fallen at press time.
XRP
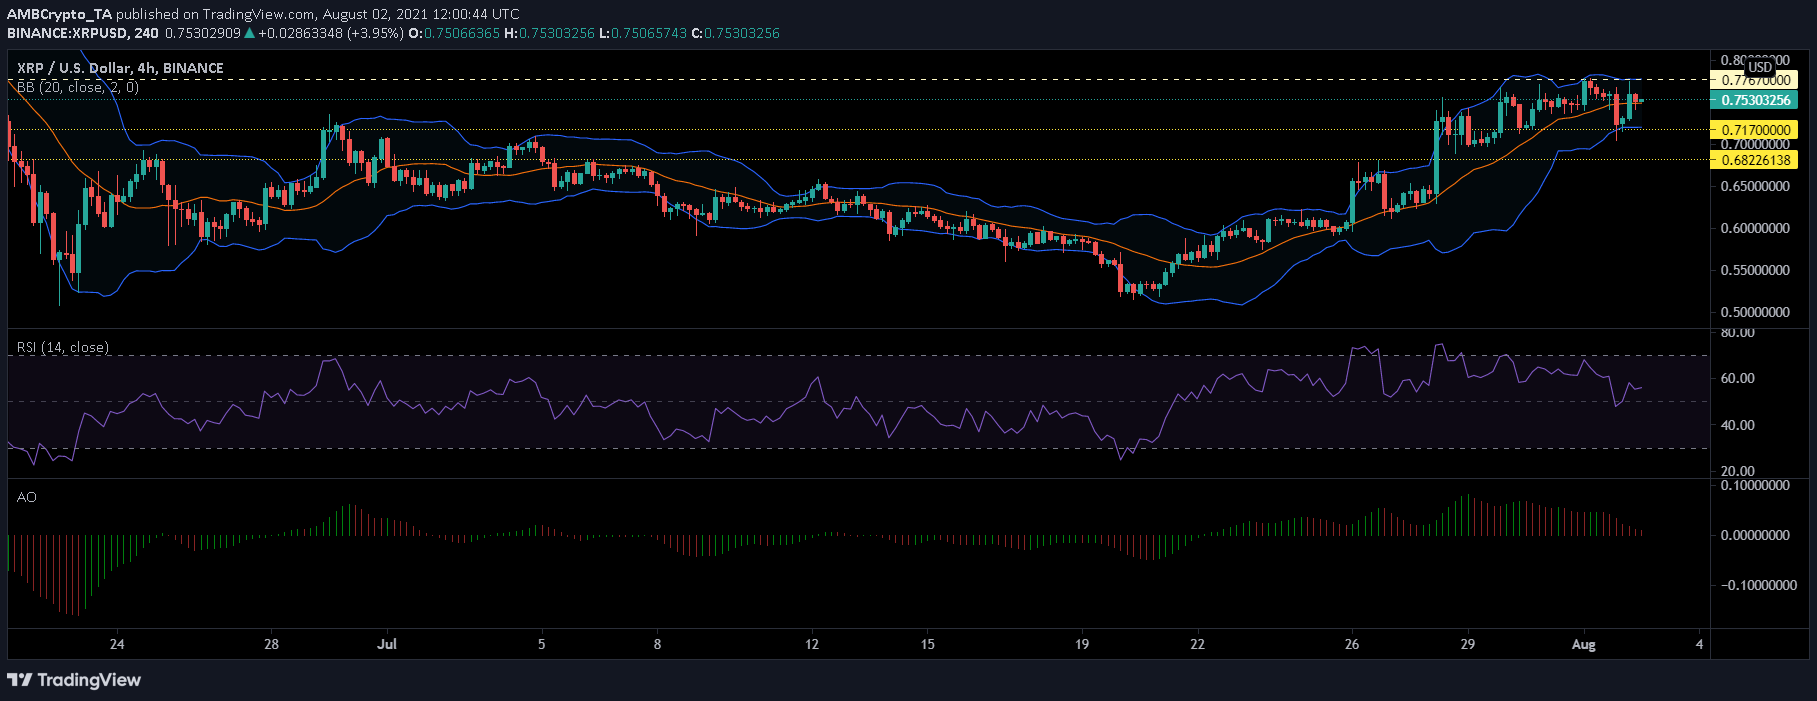
XRP’s uptrend came to a halt as the broader crypto-industry lost some of its value over the last 24 hours. This pause in uptrend led to its failure in testing its immediate resistance level of $0.77. If the price doesn’t move north, the immediate support level for XRP would be at $0.71.
Volatility can be anticipated as the Bollinger Bands diverged. Buying pressure remained fairly strong as the RSI moved away from the neutral zone.
Bearish pressure in the market was on the decline too as the Awesome Oscillator pictured red signal bars falling on the centerline.
Tron [TRX]
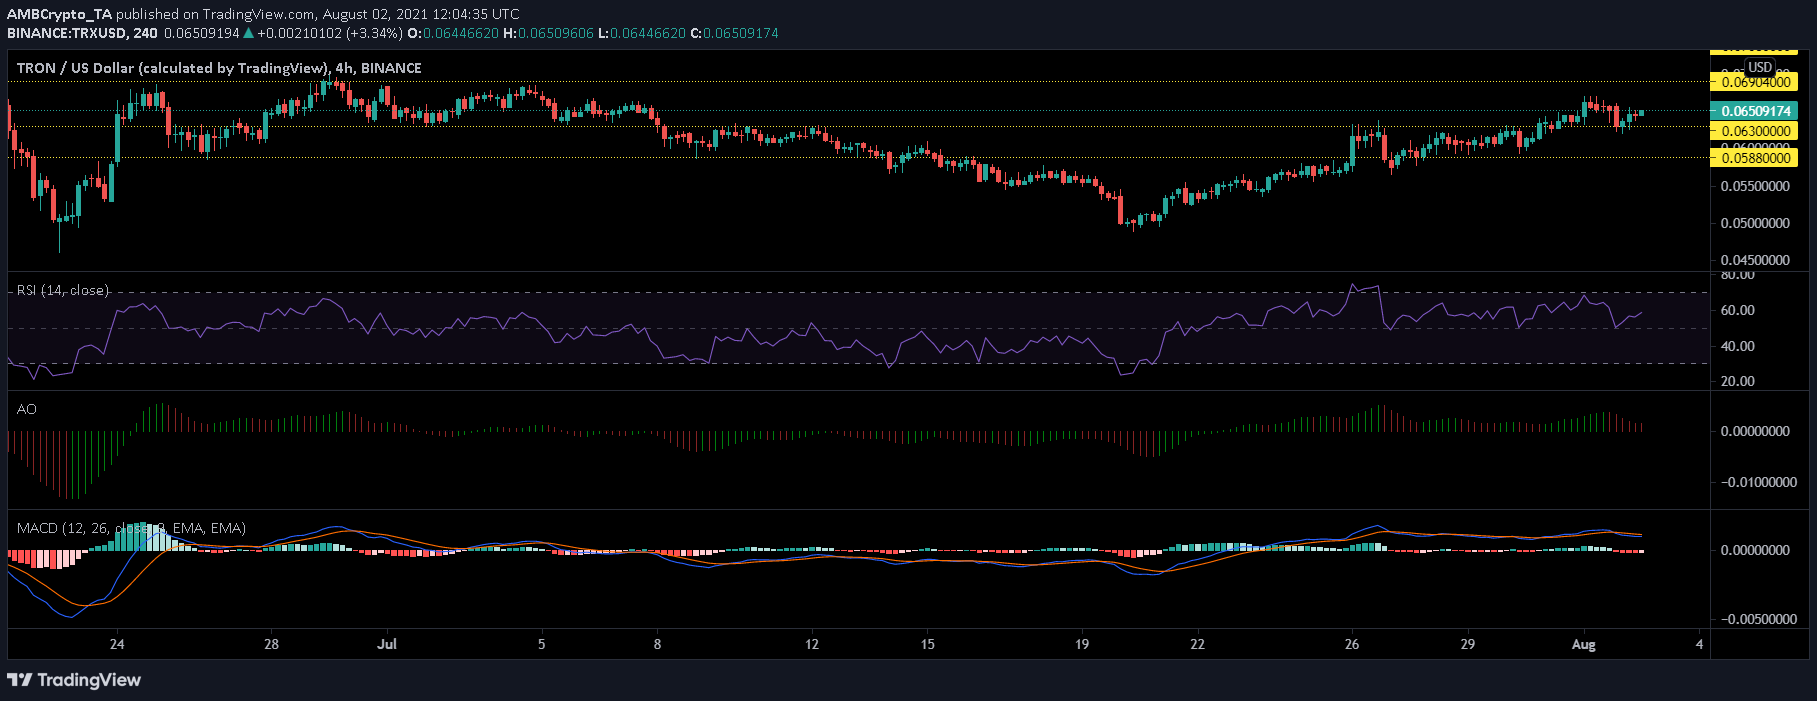
TRX’s price trajectory has been quite uniform, with a few bumps here and there. A pause in yesterday’s uptick caused it to fall by 2.2%. At the time of writing, the alt was valued at $0.0650. A further retreat in price would mean TRX being valued at $0.058 over the next few trading sessions.
The Awesome Oscillator saw red bars as bearish pressure continued to permeate the market. The MACD too saw red histograms on the chart. On the contrary, the Relative Strength Index veered into bullish territory as it approached the 60-mark.
AAVE
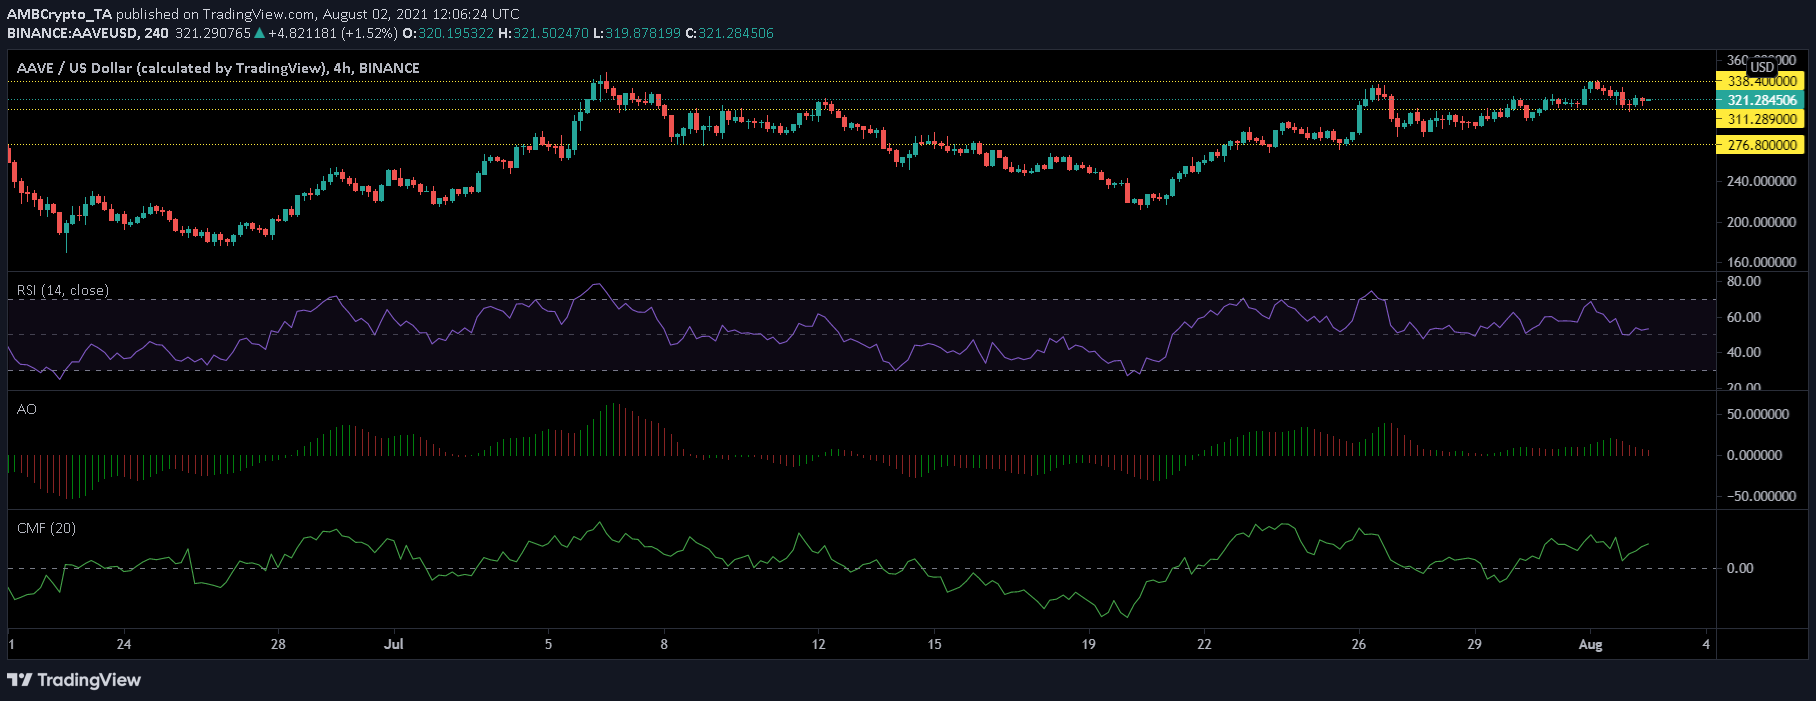
At the time of writing, the coin was valued at $321 and a further fall would make the price touch $311. Over the last 24 hours, there has been a 3.3% drop in value. Buying pressure had dipped, at the time of writing, but this corresponded to a decrease in price too. The Relative Strength Index evoked a position of equilibrium.
The Awesome Oscillator confirmed these findings. What’s more, a decrease in demand for AAVE could also be responsible for driving the price south. Interestingly enough, the Chaikin Money Flow noted quite a jump as capital inflows were higher than outflows.


