XRP, Tron, IOTA Price Analysis: 31 July

The global crypto-market cap was at $1.67 trillion with a 3.0% increase over the last 24 hours. Most altcoins were trading in the green and noted an increase in their own market capitalizations too.
XRP’s movement on the chart remained quite bullish. TRX too noted an upside, with 6% gains over the last 24 hours. Finally, IOTA continued to struggle to hike above its immediate resistance level.
XRP
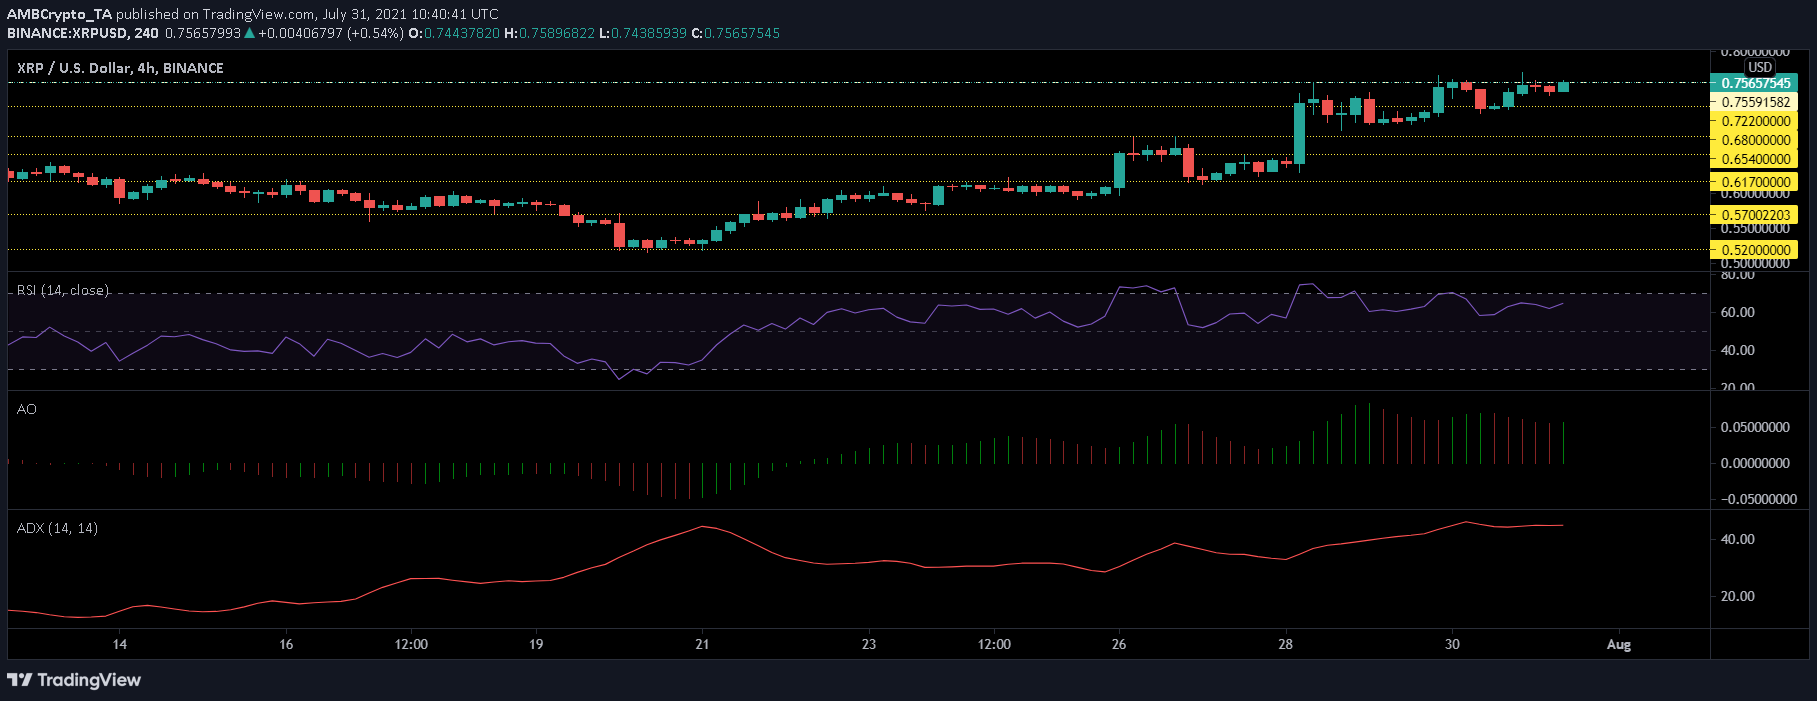
XRP moved up by 22.3% over the last seven days. At press time, it was valued at $0.75, despite noting minor gains over the last 24 hours. Further, the coin has rallied successfully since 21 July.
XRP’s major resistance level lay at $0.89 and on the flip side, the support level lay at $0.68. XRP had last touched the $0.89 level a month back.
The technical outlook for XRP was quite positive, with the indicators painting the same image. Buying pressure increased as the Relative Strength Index noted an uptick. It was in the bullish territory and this meant that buyers preceded sellers.
The Average Directional Index was seen above the 40-mark, signifying market strength. A green signal bar was visible on the Awesome Oscillator – A sign of some bullish strength.
Tron [TRX]
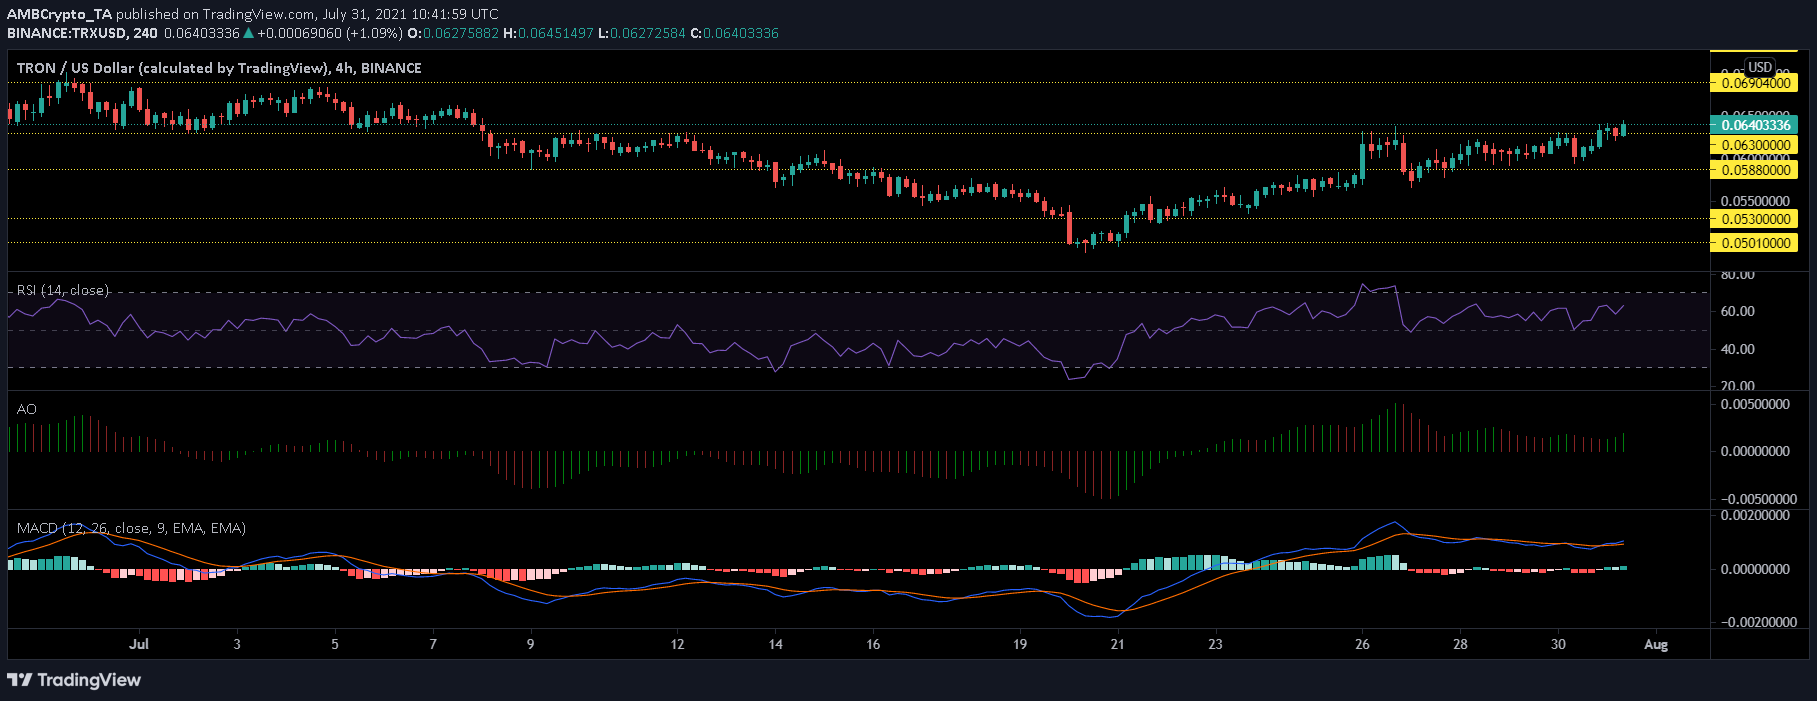
TRX was trading in the green, at press time. It was priced at $0.064 on the back of a 6.0% hike over the last 24 hours. The token fared well even on the weekly chart as it noted gains of 12.6%. The market capitalization for TRX shot up by 7.63% as the price surged.
The MACD indicator underwent a bullish crossover on 31 July. After this, green histograms were seen making an appearance, verifying the bullish momentum. The appearance of green signal bars on the Awesome Oscillator confirmed this too.
A gentle uptick was seen on the Relative Strength Index, signifying buying strength and a hike in demand for the coin.
IOTA
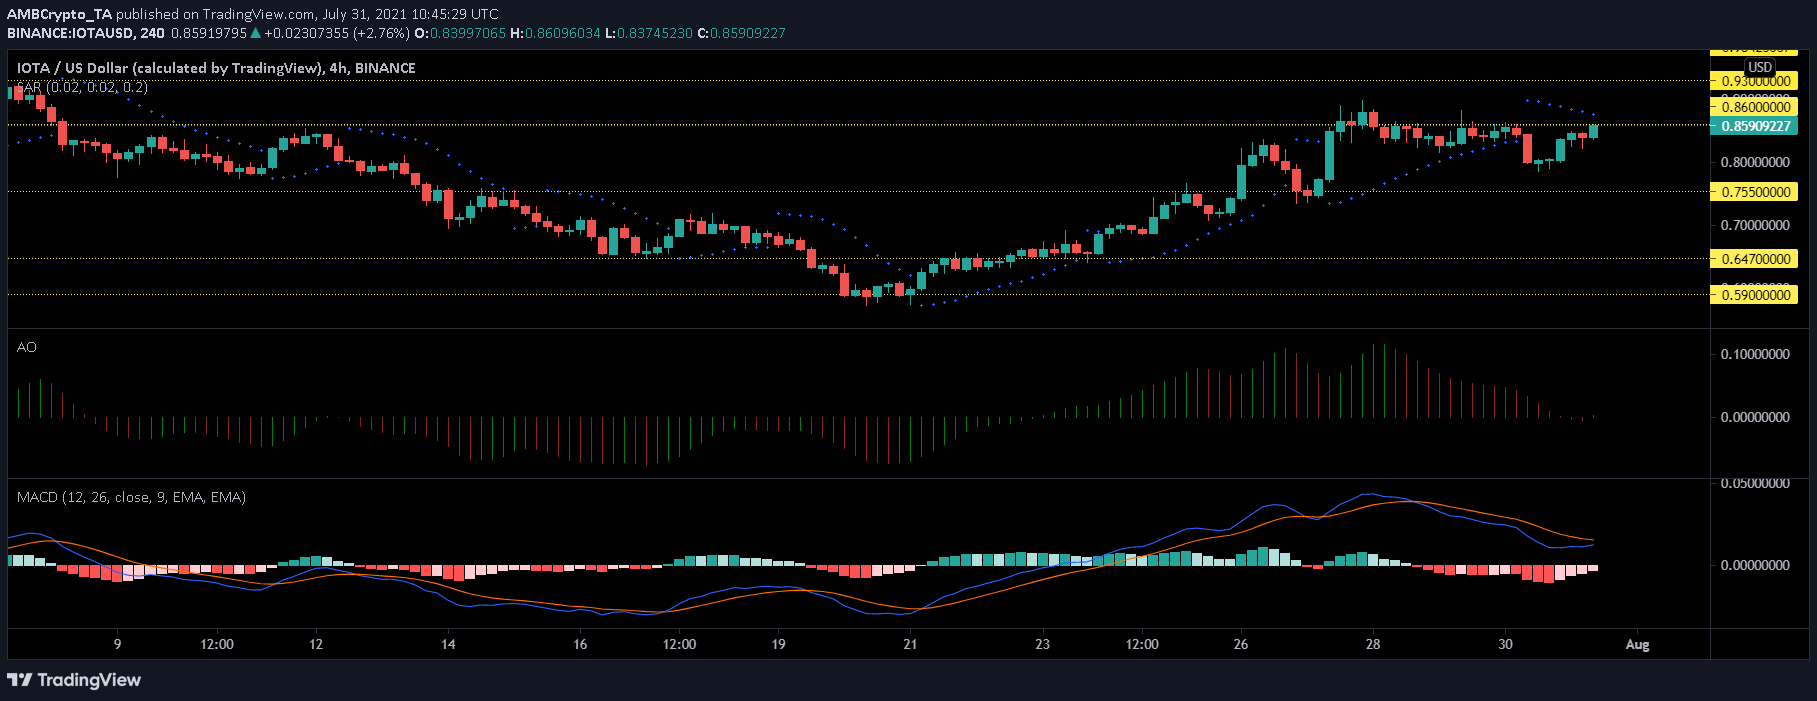
IOTA traversed below its resistance line of $0.86. At press time, the token stood just beneath the price level of $0.85. Over the last 24 hours, the altcoin regained 6.2% of its value and with a further push, it can move past $0.86.
However, its support region was at $0.76. At press time, the technical outlook still emanated bearish sentiments, but if IOTA continues to trade in the green, these technical outlooks would reverse the readings.
With mostly sideways movement, the indicators showed that it was still not out of the woods completely. The MACD flashed the presence of red histograms post a bearish crossover on 28 July.
Conversely, a single green dot was seen on the Awesome Oscillator, meaning that the price might just test the immediate resistance level of $0.86. As the price has been under the resistance level for some time, the Parabolic SAR still continued to underline a prevailing downtrend.