XRP, Uniswap, Aave Price Analysis: 02 January

The past week was a hindrance to the overall recovery phase that sprang from the long-term supports of most cryptos. Thus, Uniswap and Aave broke down from their 61.8% resistance levels while displaying a weak directional trend.
On the other hand, XRP initiated a down-channel breakout with a slight bearish preference.
XRP
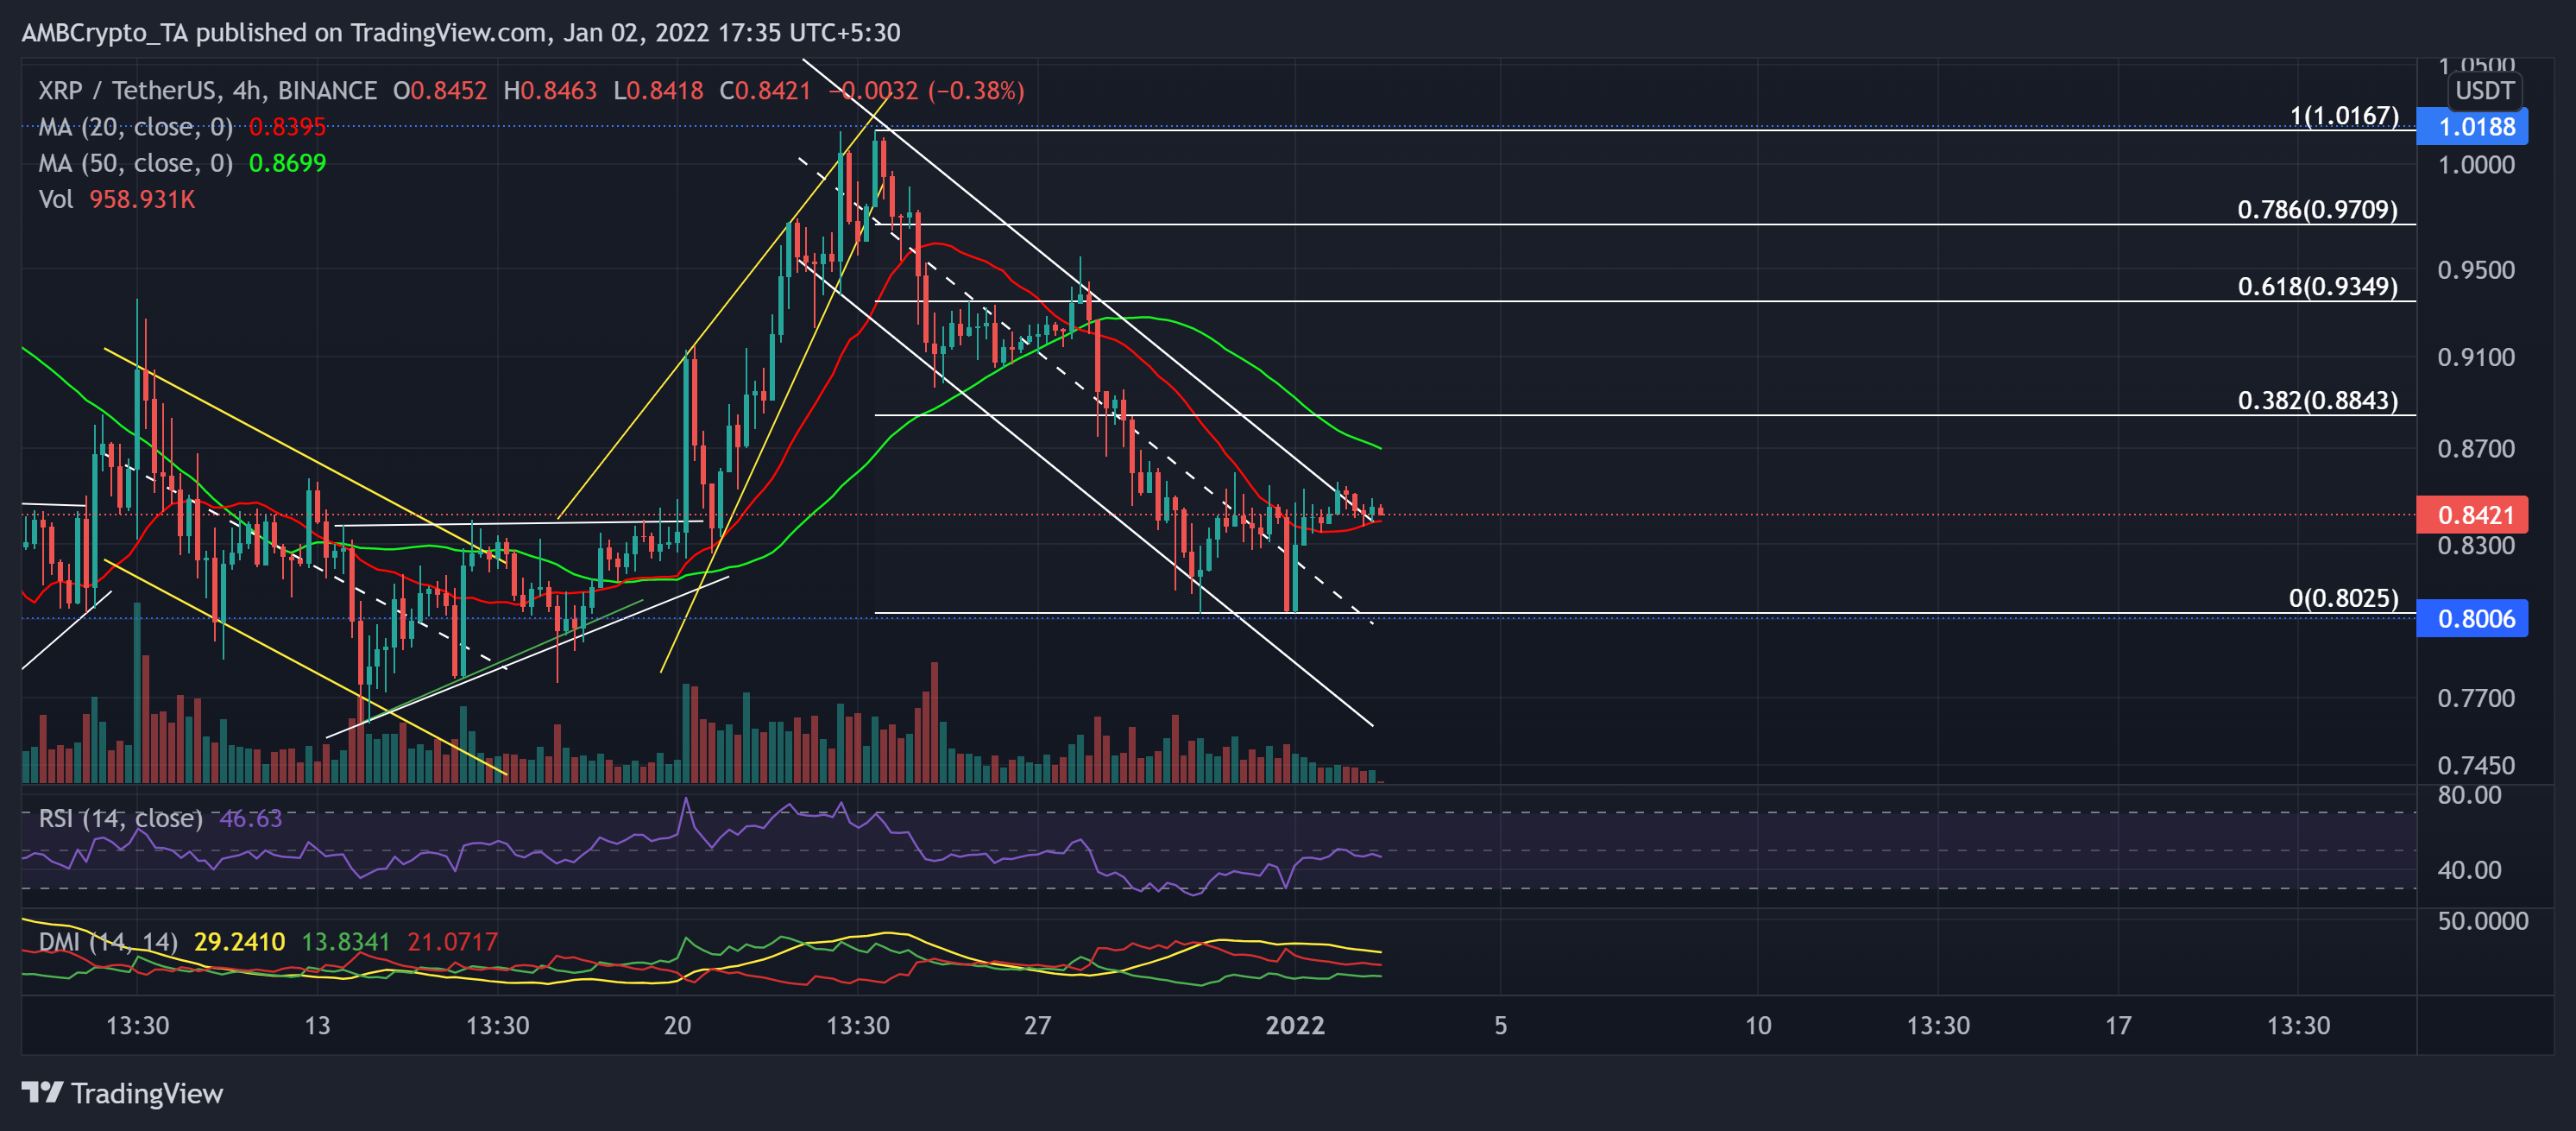
XRP bolstered its upturn in a rising wedge (yellow, reversal pattern) after the ascending triangle (white) broke out on 20 December. The alt saw a 22.95% ROI during this phase as it poked its three-week high on 23 December.
As the $1.01 resistance stood strong for over five weeks, the price action retreated in a down-channel (white). Since then, XRP marked a 20.95% retracement until 31 December. Meanwhile, the 20-SMA (red) and the 50-SMA (green) had a bearish crossover.
Now, the 50-SMA stood as an immediate testing level for the bulls as the price broke out of the down-channel.
At press time, XRP was trading at $0.8421. The RSI swayed near the midline after marking higher troughs. However, the pullback volumes (red) seemed higher than the recovery volumes recently. Further, even the DMI depicted a bearish bias.
Uniswap (UNI)
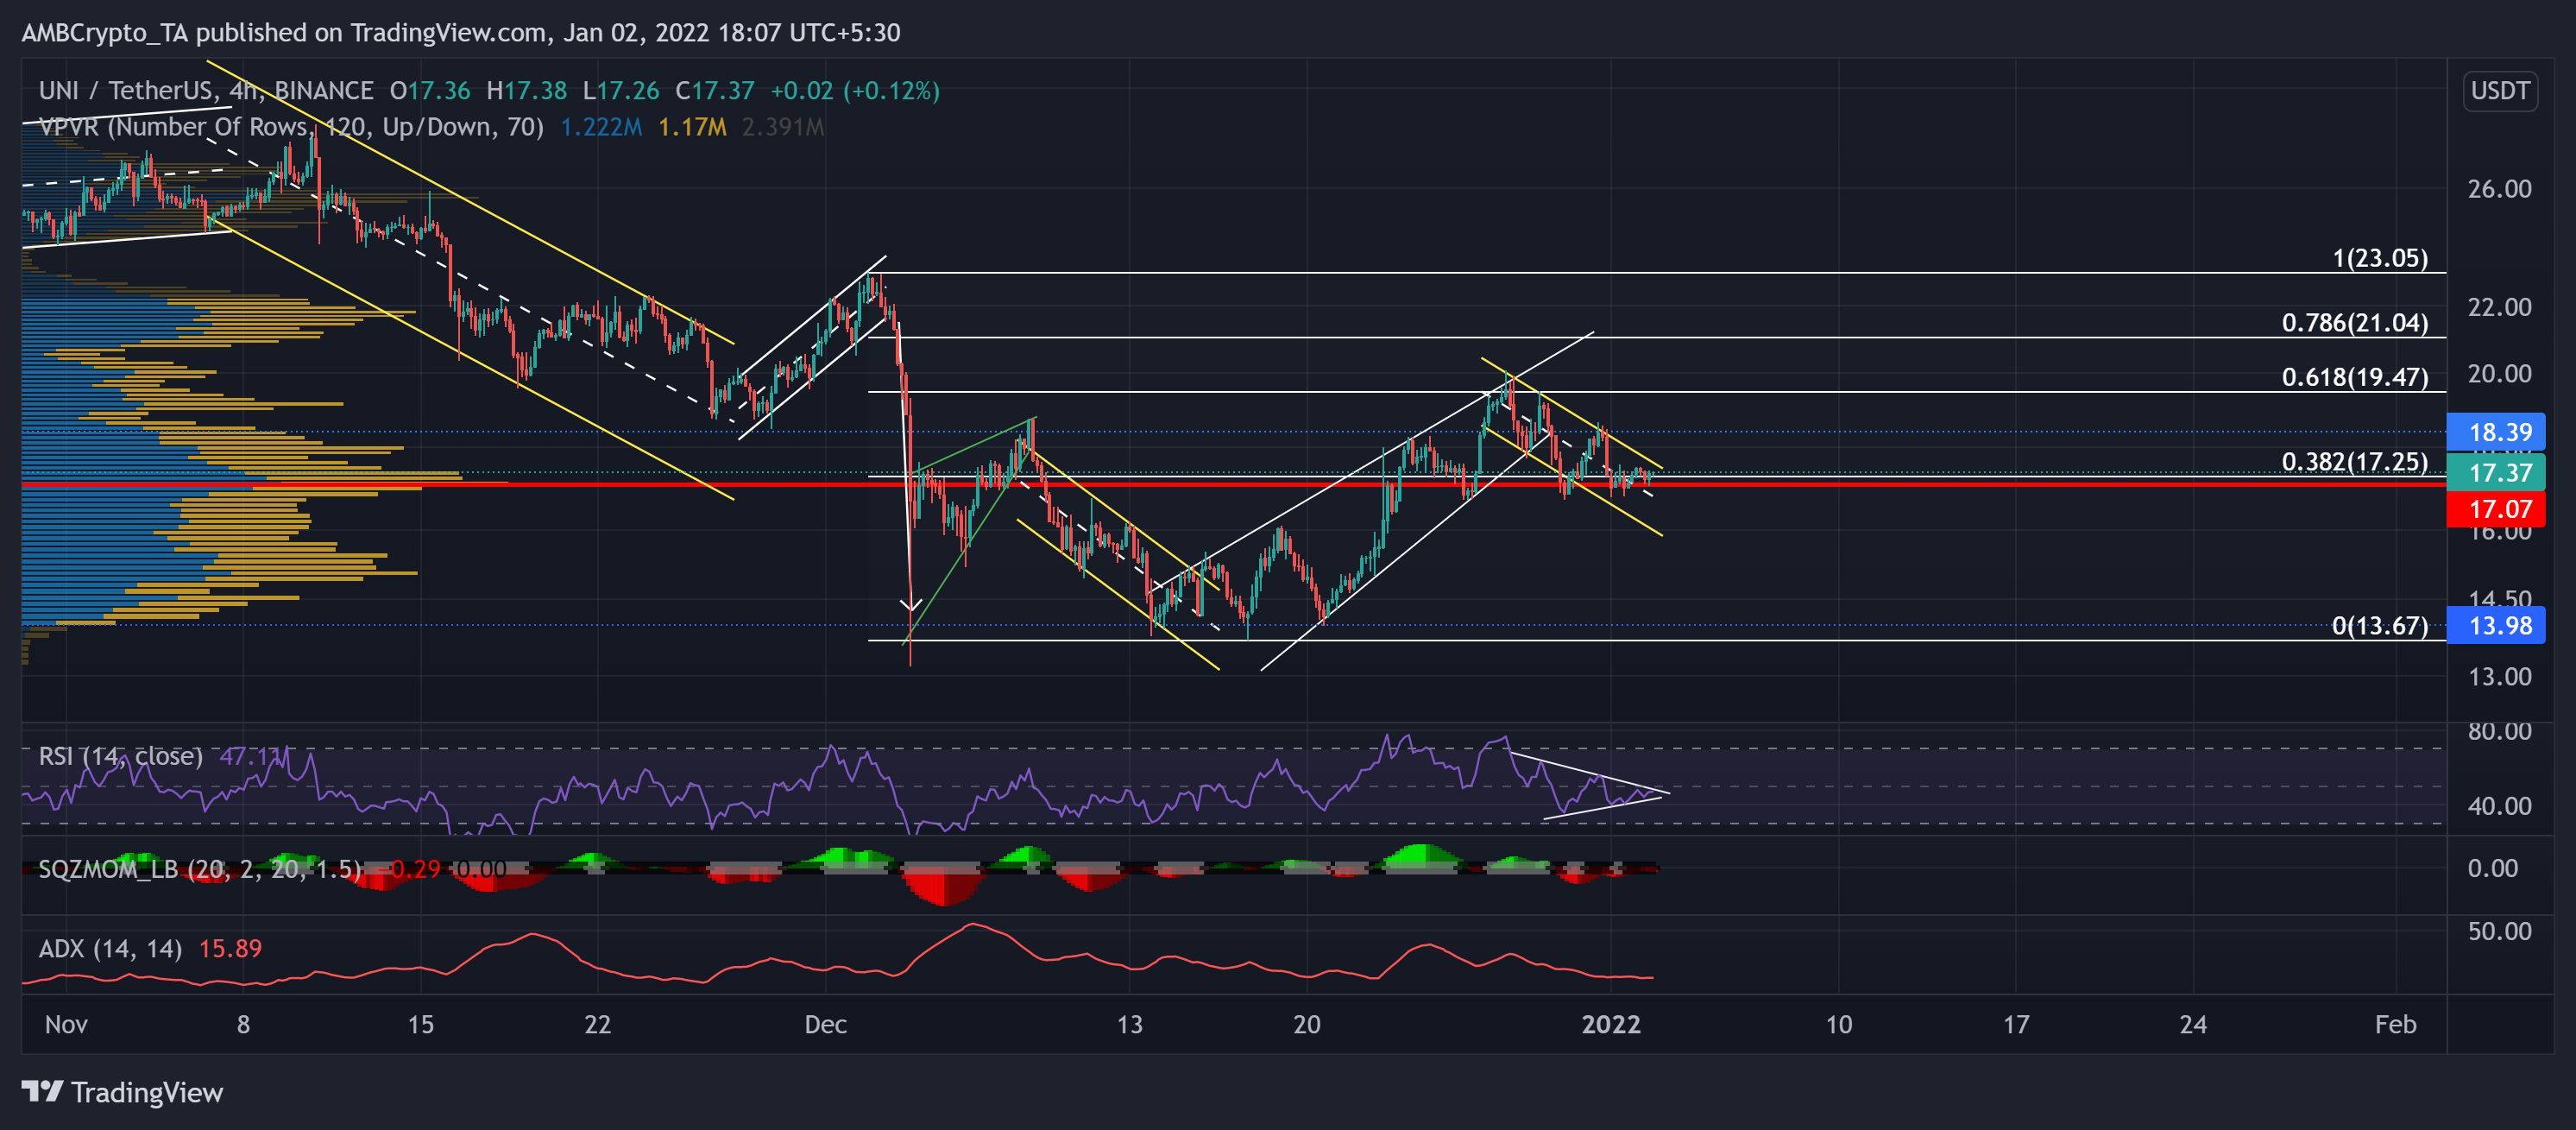
The long-term bearish streak finally reversed from the crucial 11-month support at the 13.98-mark. Since it hit its two-month high on 10 November, UNI followed the market leaders and steadily declined.
As a result, the alt lost nearly half its value until a reversal from the aforestated mark on 17 December.
The rising wedge (white) saw a breakdown from the golden 61.8% Fibonacci level. This fall found support at the Point of Control (red) near the $17.07-mark. Presently, the alt traded at an area that offered the highest liquidity for over two months. Thus, the Squeeze Momentum Indicator flashed black dots, indicating a low volatility phase.
At press time, the alt traded at $17.37. The RSI formed a symmetrical triangle and refrained from offering a bias. To top that up, the ADX displayed a weak directional trend for UNI.
AAVE
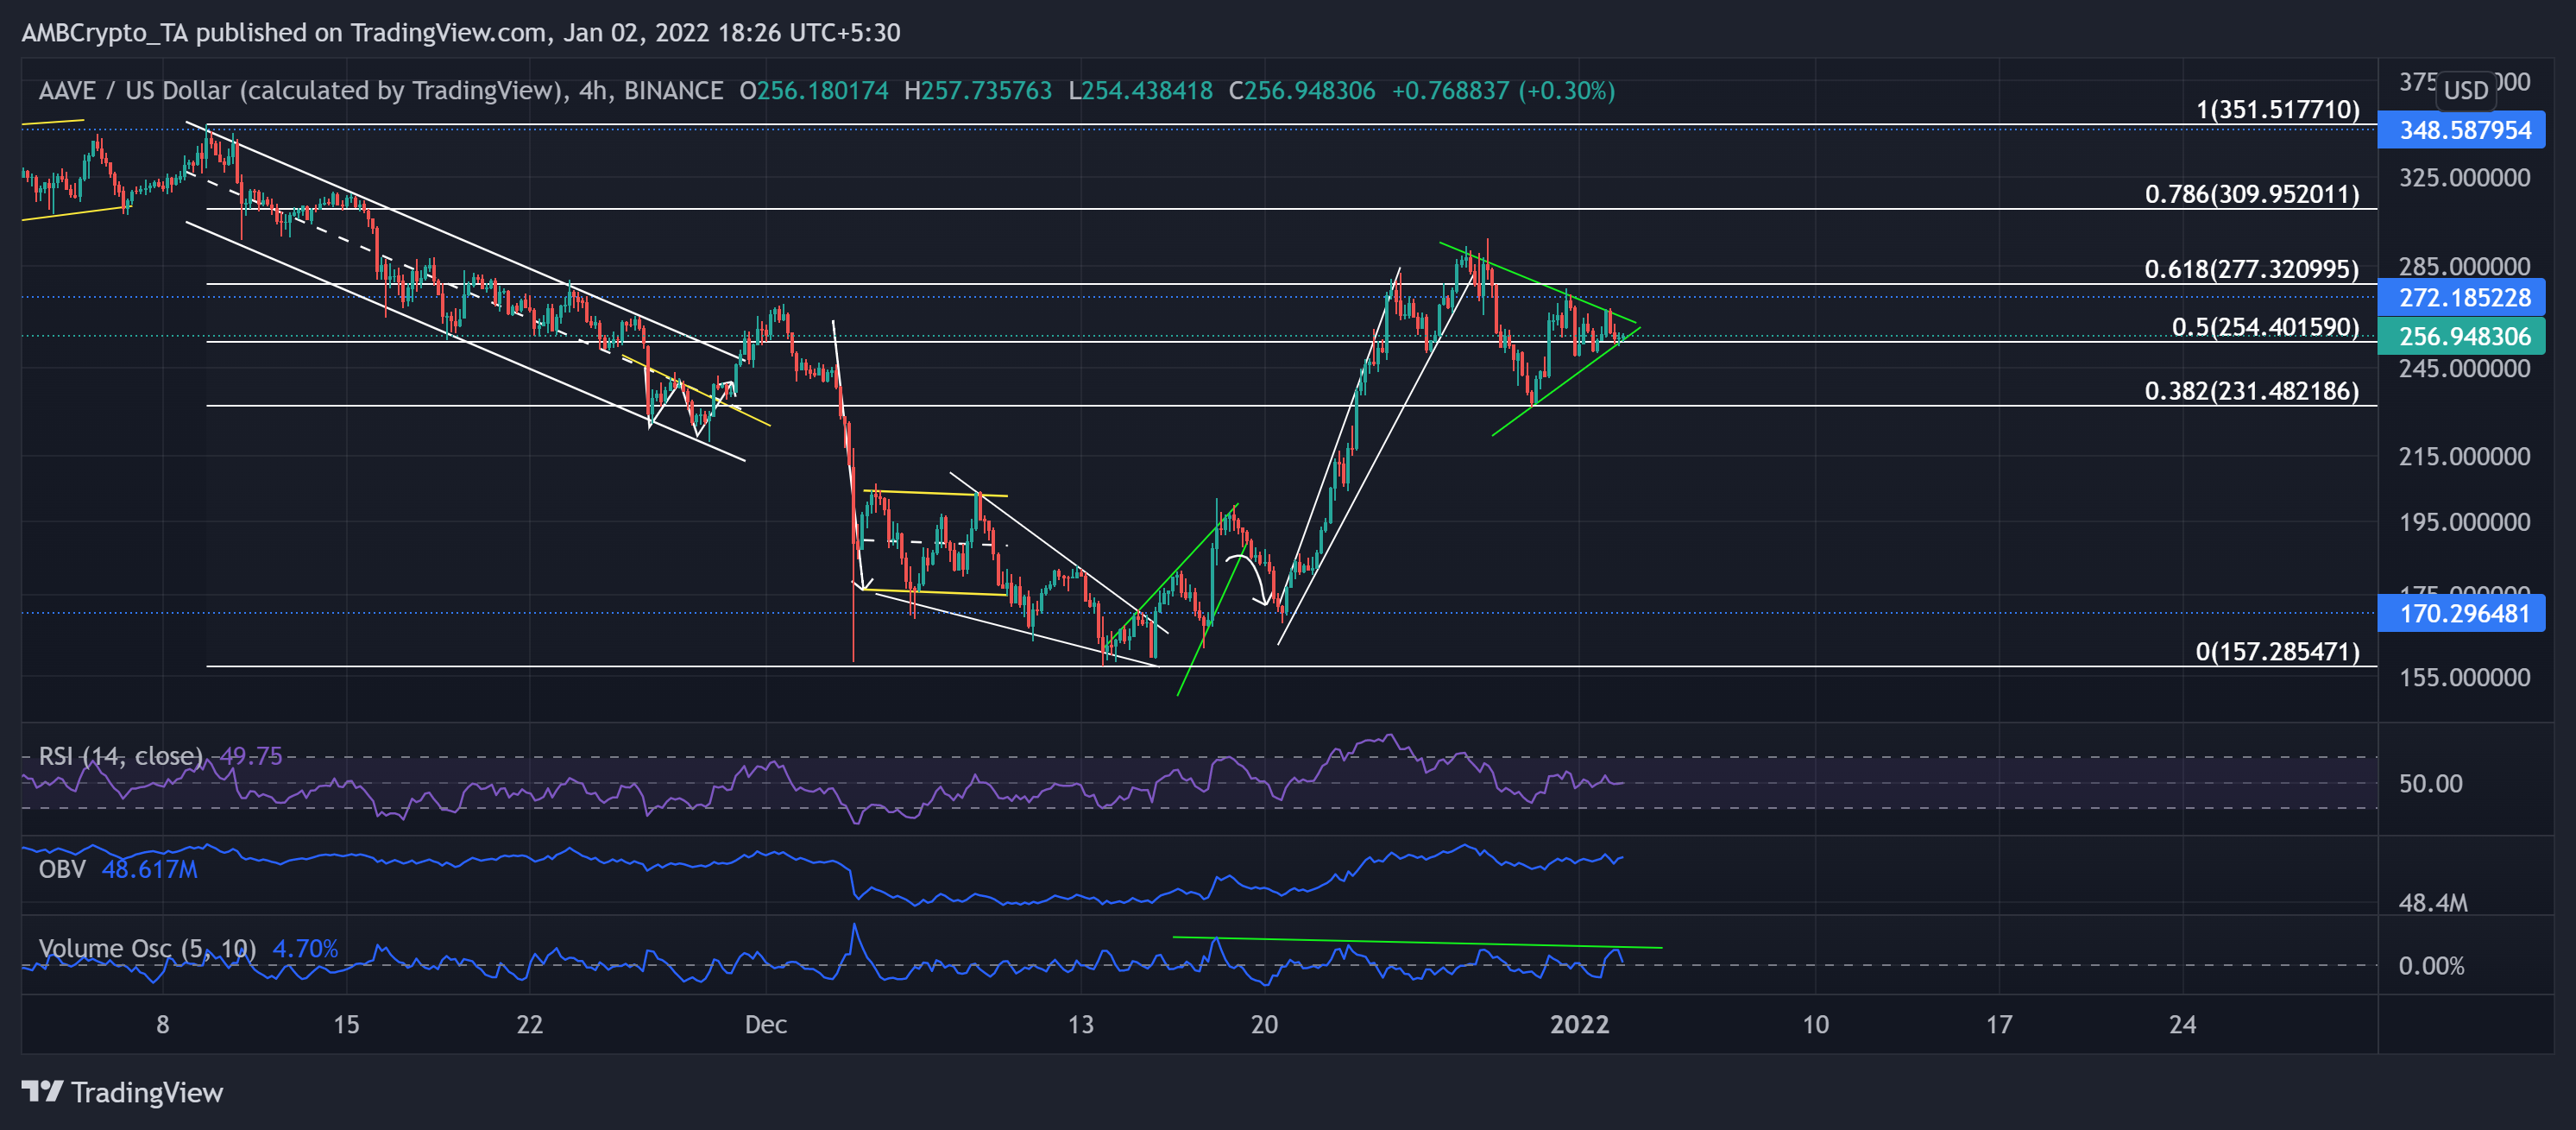
The alt reversed its descent from the crucial $170-support on 20 December. It saw a staggering 76.79%ROI (from 20 December low) until it poked its six-week high on 28 December.
Since then, the bears have ensured the longer timeframe 61.8% Fibonacci resistance as the price action fell after marking a symmetrical triangle on its 4-hour chart.
At press time, AAVE traded at $256.948 after noting a 1.7% 24-hour gain. The RSI wavered near the midline and flashed neutrality. While the OBV confirmed the increased buying pressure, the Volume Oscillator failed to mark higher peaks during the recent growth phase.