$30,000 or $100,000, where will Bitcoin stand by Christmas

Bitcoin’s price has yet again entered a stagnation zone. The value of the market’s largest crypto was down by 1.42% and 0.68% in the weekly and daily time window respectively. A host of factors including absence of momentum, low trading volumes, weak social sentiment, and the sluggish participation by whales have hindered BTC’s rally this time.
Refueling the $30k vs. $100k debate
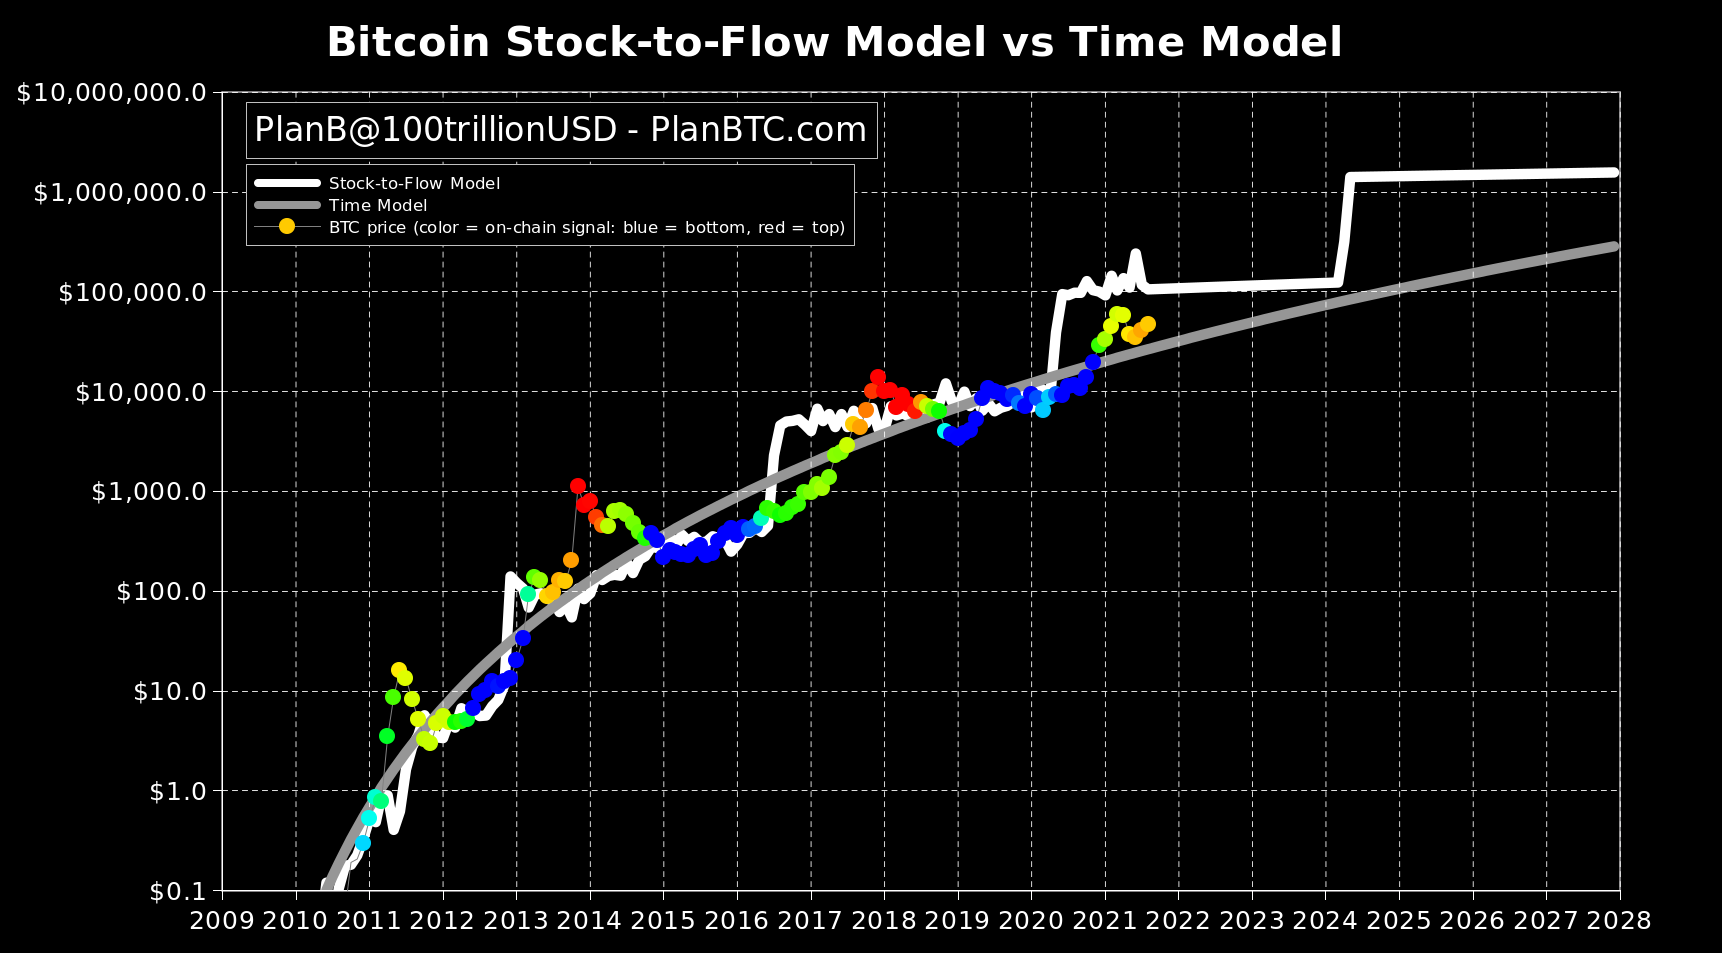
Popular analyst Plan B recently reopened the possibility of Bitcoin crossing $100k as per the S2F model prediction. However, as per the indication of the time model created by Trololo in 2014, BTC’s price can bottom-out to $30k by the end of the year.
As can be seen from the chart attached, Bitcoin’s price is currently above the time model. Hence, expecting lower prices at this stage seems logical. In fact, whenever BTC’s price has traded below the aforementioned model, its price has ended up correcting itself.
On the other hand, Bitcoin’s price is currently below the price projected by the S2F model. Whenever the price remained below this model in the past, it rebounded drastically. Hence, it will be interesting to witness the unfolding scenario in the coming months.
Which narrative does the current trend support
A couple of interesting trends have been observed in the BTC market of late. For starters, the last two days (26 August and 27 August) saw the highest transferred value in terms of USD in Bitcoin’s history. The spikes were as high as $94 billion on Thursday and $102 billion on Friday.
Furthermore, Bitcoin’s retracement ratio that was lingering in the negative territory until recently, made its entry back into the positive territory. In fact, it’s currently at par with the 0.2 level achieved during the initial phase of the 2021’s rally.

Again, as seen in the chart above, Bitcoin’s price mostly rallied whenever the retracement ratio was positive and depreciated whenever the same remained in the negative territory. By and large, this emits a bullish signal at the moment.

Further, John Wick’s HTF indicator pointed out that Bitcoin has stepped into the volatility squeeze zone. The last four times that this happened, the market witnessed a change in trend. For instance, in July 2020 a bull run was propelled right after this signal was emitted.
Similarly, in April this year, it managed to squeeze the market below the $60k highs achieved. While in July, it propelled the market out of a 3-month consolidation period. This, to a fair extent, means that a swing in either direction can be expected at this stage.
Ergo, if the squeeze pushes BTC’s price northwards, the $100k target would be pretty achievable by Christmas. However, if the squeeze triggers a price dip, the door to $30k would once again be opened. A definitive trend would end up revealing itself within the next few weeks.