Bitcoin Cash, NEO, IOTA Price Analysis: 08 September
Following Bitcoin and Ethereum’s price action, altcoins such as Bitcoin Cash, NEO and IOTA noted strong declines on their respective charts. Bitcoin Cash, following a 13.8% fall, eyed its multi-week low of $598.80. NEO substantially fell by 21.5%, while inching near its one-month low of $41.16 and IOTA declined by 9.2%.
Bitcoin Cash (BCH)
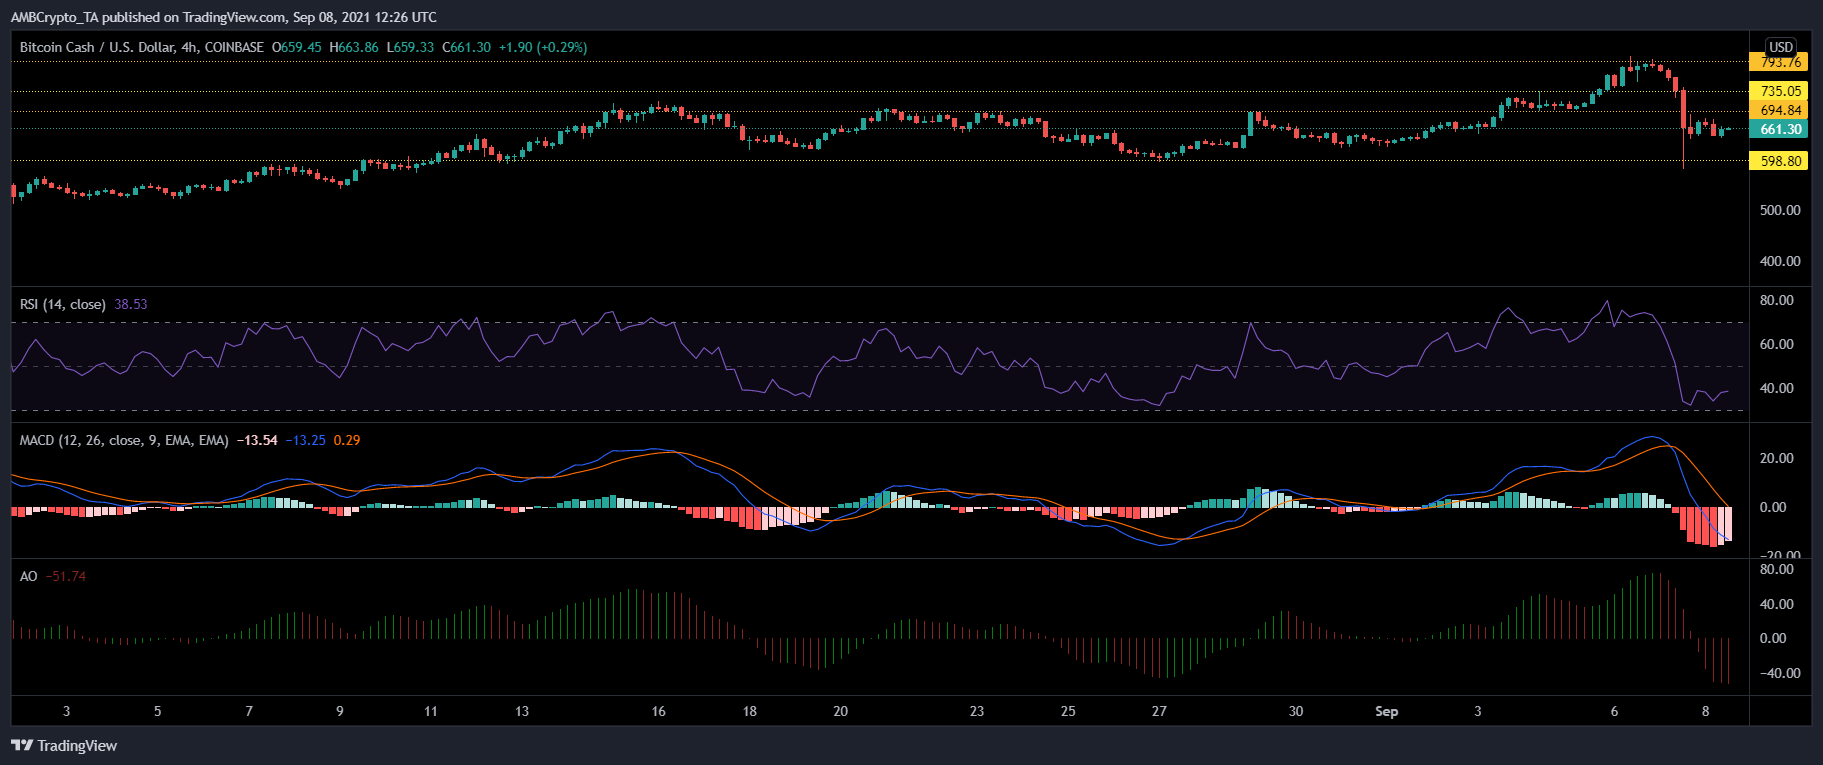
BCH declined 13.8% over the last 24 hours and was trading at $661.30. The altcoin broke below the price floor of $694.84 and was nearing a four-week low of $598.80. Its technical chart pointed towards a bearish price action.
Relative Strength Index was below the mid-line as buying pressure was at a two-week low. MACD depicted red bars on its histogram. Awesome Oscillator noted red signal bars.
In a reverse scenario, the resistance level for BCH, lay at $694.84 and then at $735.05. Upon crossing the aforementioned price levels, BCH could revisit its all-time high of $793.76.
NEO
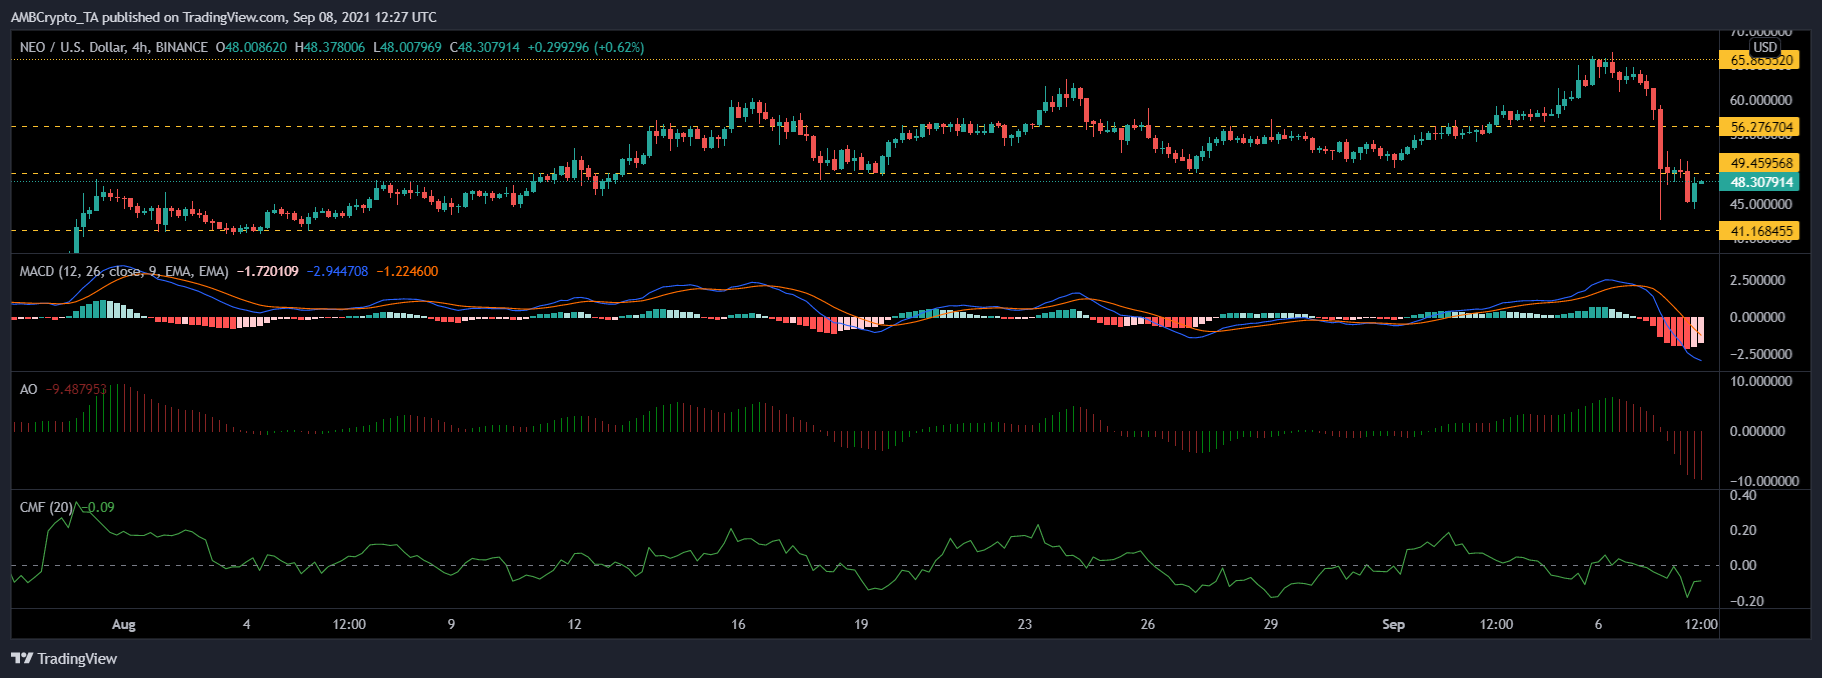
NEO plunged 21.5% over the 24 hours and was trading at $48.30. It fell below its support level of $49.45 and was moving towards $41.16; which was the coin’s one-month low price level. Parameters for the coin remained bearish at the time of writing.
MACD flashed red bars on its histogram, and in correspondence Awesome Oscillator displayed red signal bars. Chaikin Money Flow remained below the half-line as capital inflows decreased.
On the other hand, NEO might attempt to topple over $56.27 the price mark, and then revisit the multi-month high of $65.86.
IOTA

IOTA was trading at $1.53 following a decline of 9.2% over the last 24 hours. With further downward movement, it could trade near the price floor of $1.34. Failing to sustain above the aforementioned level, IOTA could head down to trade at its weekly low of $0.956.
On the 4-hour chart, candlesticks were below the 20 and 50 SMA, indicating that the momentum of the coin was in favor of the sellers. MACD observed red bars on its histogram. Awesome Oscillator noted green signal bars, after a series of bearish bars, as the latest trading sessions were in the green.
In case IOTA continued to trade in the green, the immediate price level lay at $1.70. Toppling $1.70, it could revisit the $1.83 level and then retest its four-month price high at $2.00.