Bitcoin Cash, Waves, Dogecoin Price Analysis: 16 June

At the time of writing, Bitcoin Cash was starting to note some minor selling pressure, while Dogecoin remained surprisingly unaffected by Elon Musk’s latest tweet. Finally, Waves’ price chart pictured a small but consistent increase in price.
Bitcoin Cash [BCH]
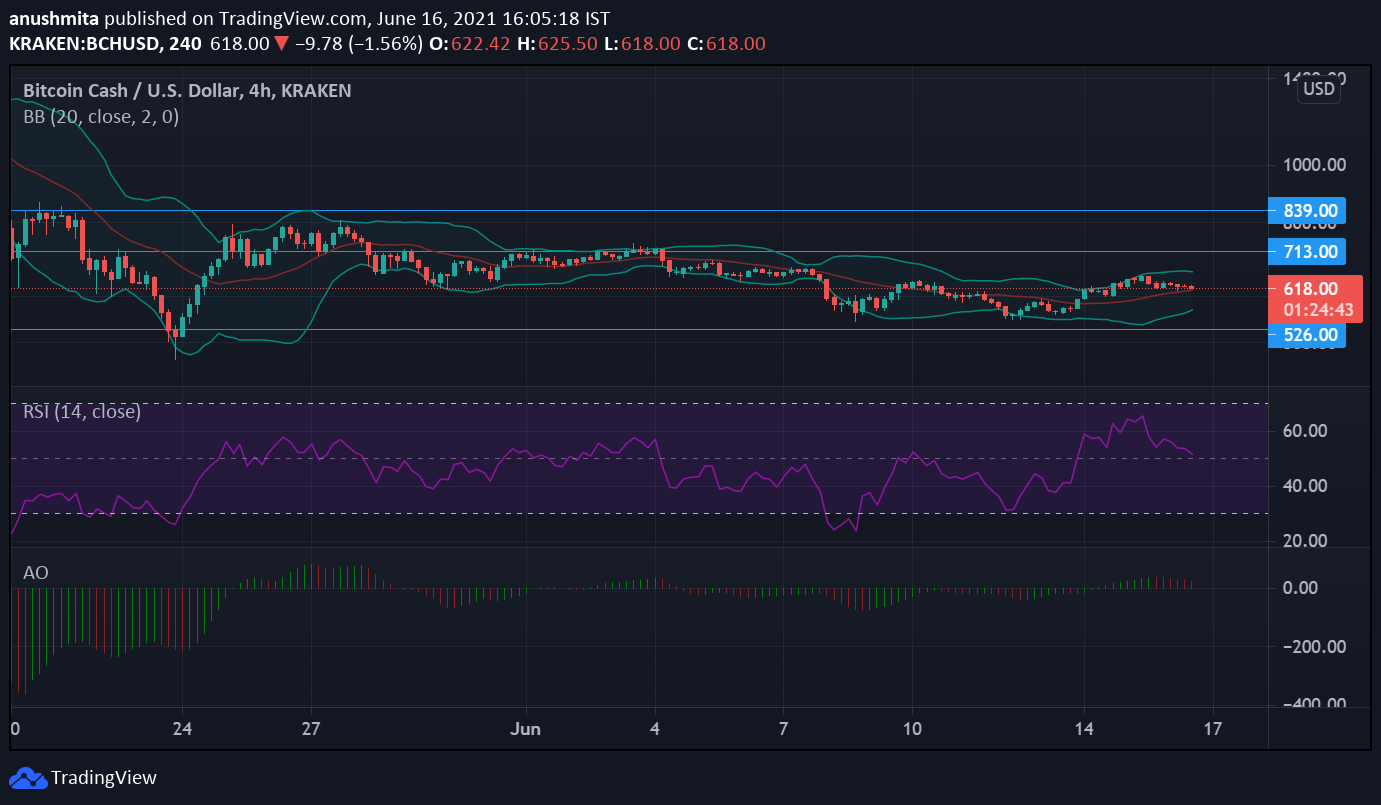
Bitcoin Cash fell by almost 10% on June 7, and it took a week’s time after that for the alt to recover its losses. The token was available at $614.12 on June 16, with the coin recovering by 6% in 2 days. BCH was oscillating between the $570 support and $720 resistance level.
The alt had been trading in the red for the past couple of days and even then, it had not crept below the $570 support level. According to the Awesome Oscillator, bearish momentum has been the norm over the past few days.
The Bollinger Bands pointed to low price volatility as the bands, while not quite narrow, were parallel. Abrupt price fluctuations are not anticipated for BCH. As soon as the alt started to see a minor price correction, the buying pressure increased between June 14 and 15.
The Relative Strength Index signaled that the market almost had even numbers of buyers and sellers, despite the latter gaining the upper hand of late.
WAVES
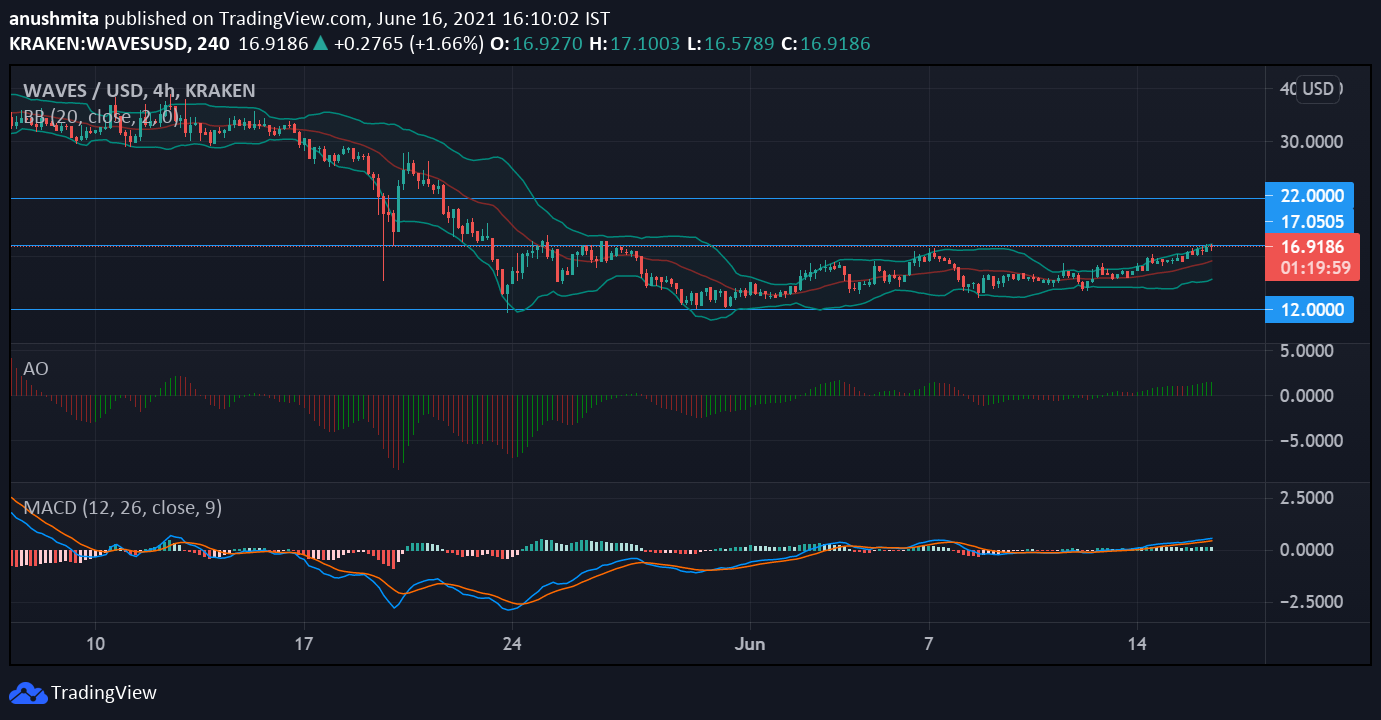
Waves has undergone dramatic price fluctuations lately. When the month began, the price of Waves jumped by 100%. This month though, prices have fallen considerably. There has been sideways movement for the alt since the beginning of June, despite the fact that after June 10 the coin has slowly embarked on a northbound journey.
During the month of May, the coin stayed well above the $17 support level. With increased price fluctuation in June, the $17 mark is the new resistance level. The coin, in case of a further surge of prices, will break past the $17-ceiling. The token was available at $16.30. at the time of writing.
The MACD histogram showed a bullish crossover on June 14 and ever since then the coin has progressed with bullish momentum. The opening up of the Bollinger Bands after June 14 indicated that volatility could be on the rise.
The Awesome Oscillator’s reading corresponded to the above statement as it demonstrated a bullish trend for the coin.
Dogecoin [DOGE]
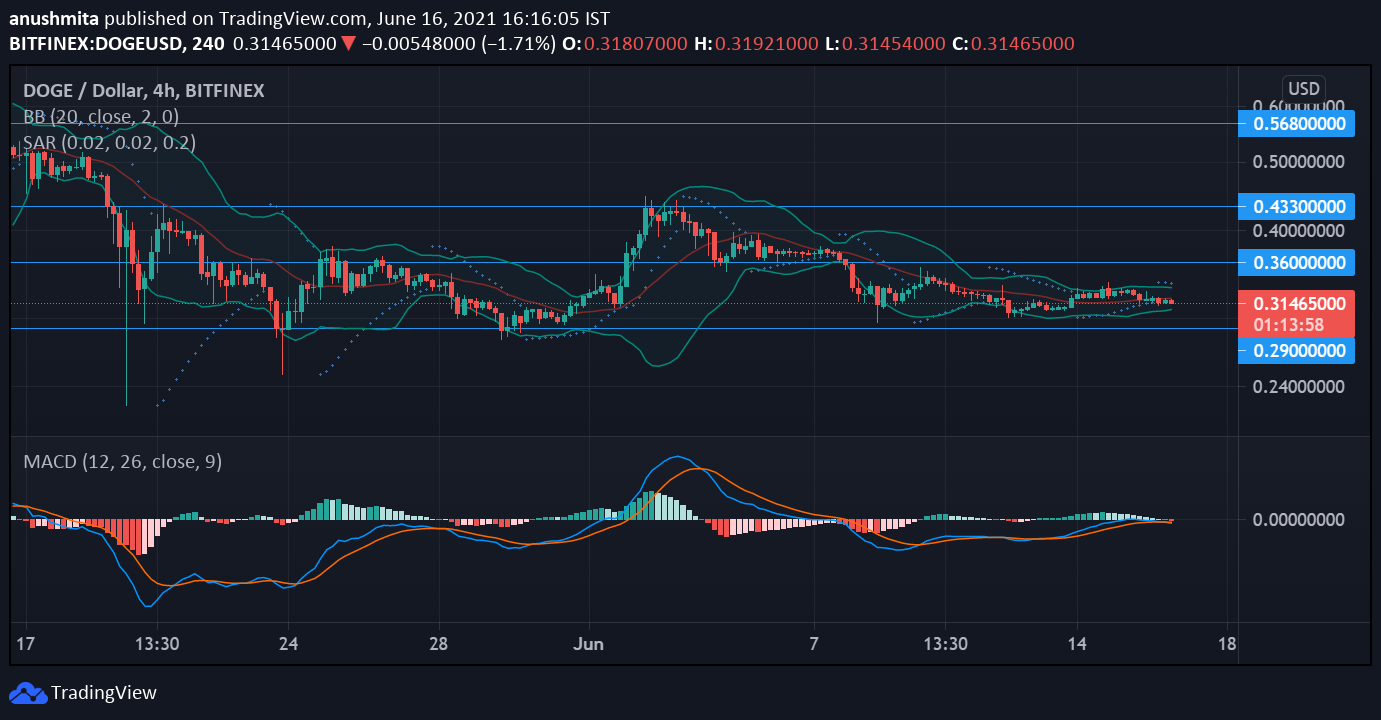
DOGE had been moving sideways since the crash on June 7, with the coin oscillating between the $0.30 support and $0.37 resistance level for almost one week now. The coin had picked up momentum at the beginning of June but it could not hold on to the same and it started to dip even before the crash on June 7.
The coin saw some bullishness on June 13 as the prices had started to rise slowly. The MACD’s histogram indicated that since June 13, the alt has moved on with bullish momentum as there was a bullish crossover on 13 June.
As its price dipped in the last 24 hours by 3.7%, the Parabolic SAR pointed to the beginning of a downtrend. DOGE’s price can be expected to remain stable and move sideways. Finally, the Bollinger Bands remained constricted and suggested that DOGE won’t see a hike in price volatility.


