Bitcoin: Three indicators signal this about BTC’s price

Bitcoin’s price has successfully been able to rally by 15% over the past week. After a period of more than three months, the king coin managed to break above its descending trend line and its valuation stood at $45.8k at press time. However, the relevant question at the moment remains whether or not Bitcoin would be able to continue its uptrend.
What do the indicators say?
A price rise usually corresponds with a rising market cap. However, the same does not always imply that the market is doing well. The market cap, as such, is impacted by trading algorithms, spot pricing and derivatives in real time. Ergo, it can be considered to be noisy metric that sends out false signals. The realised cap, on the other hand, filters out the off-chain exchange volume. Doing so, makes the realized cap a bit slow to react to real time activities.
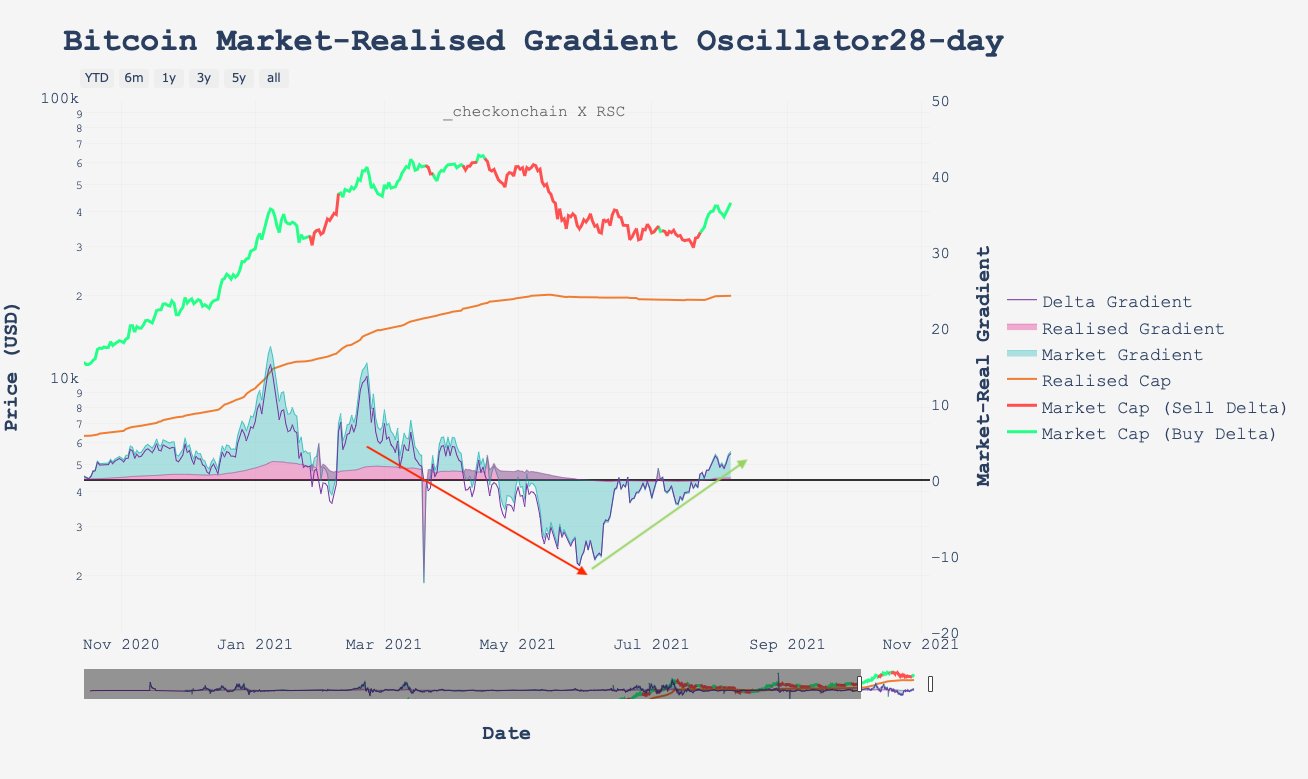
To overcome ‘noisy’ and ‘slow’ setbacks, Market Realised Gradient Oscillator can be used. This metric helps gauge the spot market HODLer sentiment and the change in momentum. Whenever realized and market gradients get steeper with time, it means the acceleration of an ongoing trend is likely.
Now higher oscillation peaks can evidently be witnessed in the chart attached below. This, in turn, is indicative of an upward momentum shift. As a matter of fact, the momentum was trending down in the negative territory since the past couple of months. However, the same stepped into the positive territory on 23 July and has continued to inch northward since then.
Historically, an uptrend has more often than not translated into a bullish narrative. An uptrend at this stage essentially implies that coins last spent at lower prices are being spent at higher prices. The zoomed-out chart additionally highlights that every major rally that has happened over the past few years has been accompanied by a substantial amount of positive momentum. Ergo, for the Bitcoin market to flourish in the coming days, the same trend needs to continue.
Furthermore, Glassnode’s data pointed out that the coin-days destroyed has made two massive peaks in the past 3-weeks. In fact its current level matches that of late 2019. Now, this highlights that long-term investors are spending coins to realise profits and are taking advantage of the market strength.
It essentially also means the the dormant supply has been reactivated into liquid circulating supply. During the initial stages of a typical bull market, old coins are spent to take profits and new investors, in turn, buy them. CDD tends to trend higher in bullish markets around local price tops and such ‘disbelief rallies‘ are essential to trigger a long-term bull run.
The ASOL too, for that matter, seemed to be pretty high at the time of writing. This is again indicative that old coins are being spent. As can be seen from the chart attached, whenever ASOL has peaked, the market has mostly witnessed a rally in the days that followed.
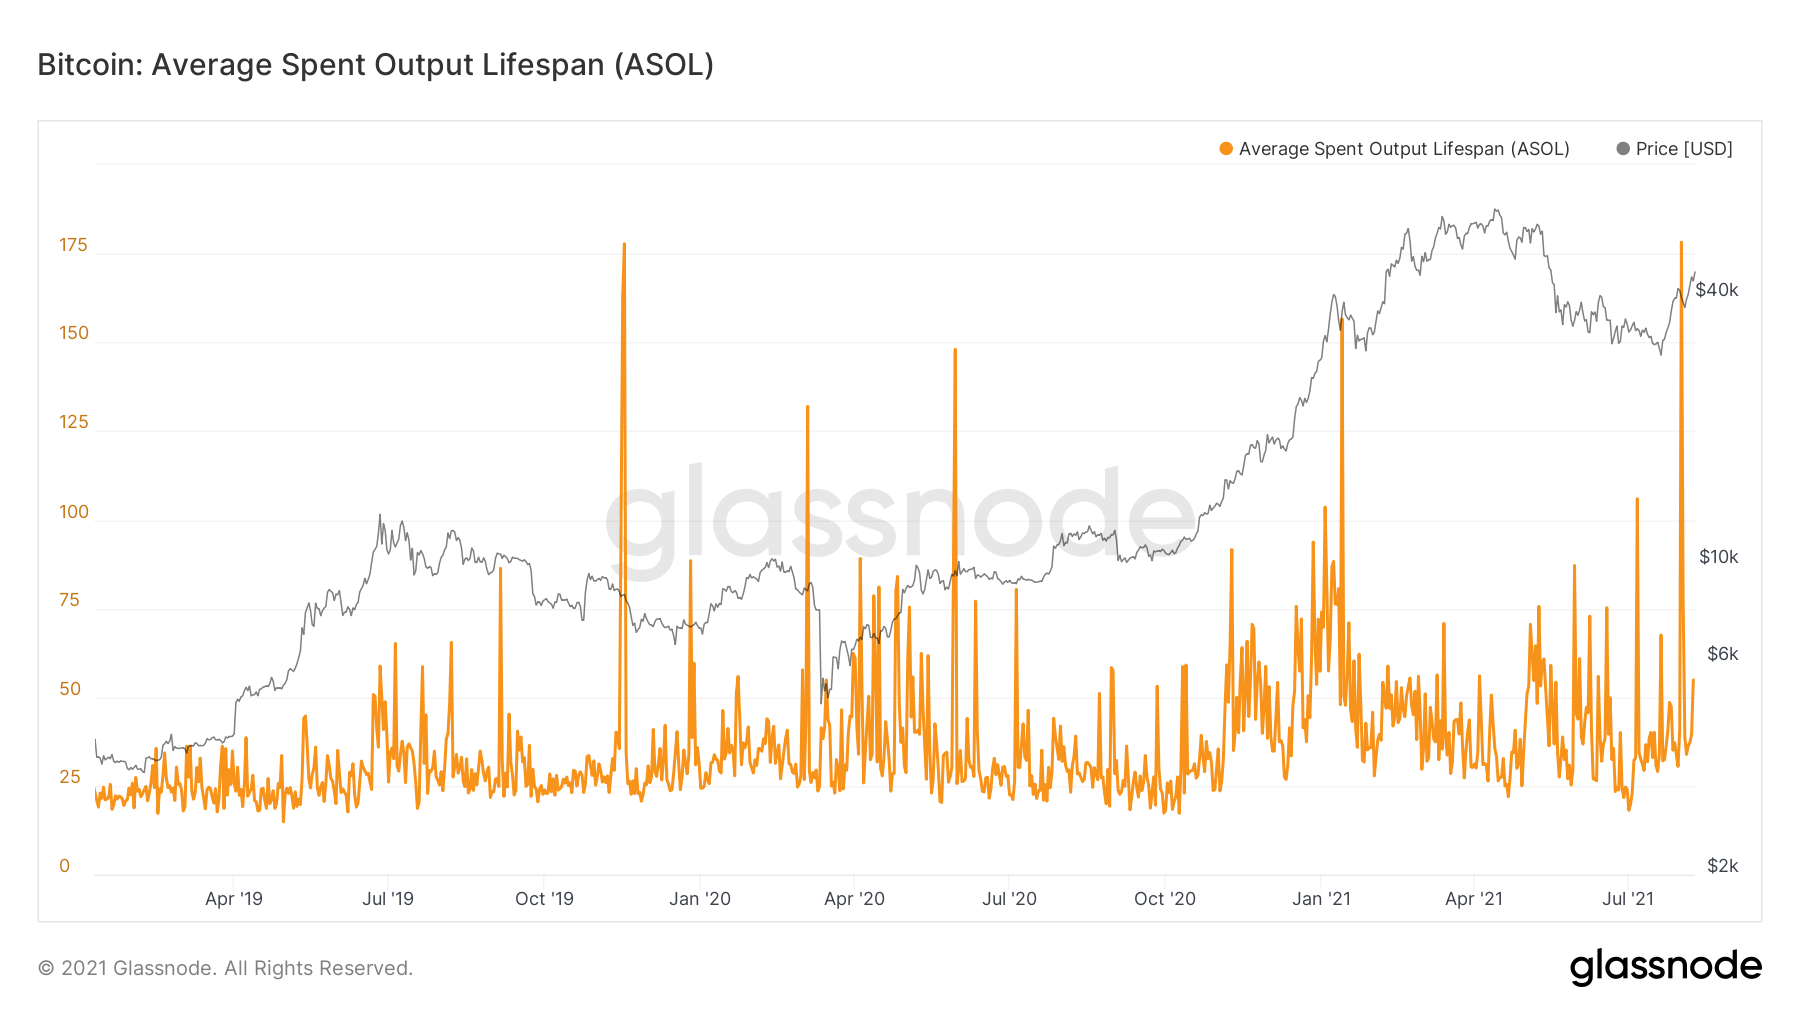
Hence, for Bitcoin’s price to continue to rally, the momentum needs to make higher strides in the positive territory. However, if it remains stagnated at its current level, a brief correction can be anticipated. Else, Bitcoin’s price is all set to create higher highs in the coming weeks.