Can LTC’s growing hashrate sustain its ongoing price rally? Evidence suggests…

Litecoin’s [LTC] recent, unprecedented surge could be responsible for making the altcoin a hot topic in the cryptocurrency market. As per CoinMarketCap, LTC’s price grew by more than 29% in the last seven days.
This was substantially better than most cryptocurrencies, however, LTC stood behind Polygon [MATIC]. At the time of writing, LTC was trading at $71.46 with a market capitalization of more than $5 billion.
______________________________________________________________________________________
Here’s AMBCrypto’s Price Prediction for Litecoin [LTC] for 2023-2024
______________________________________________________________________________________
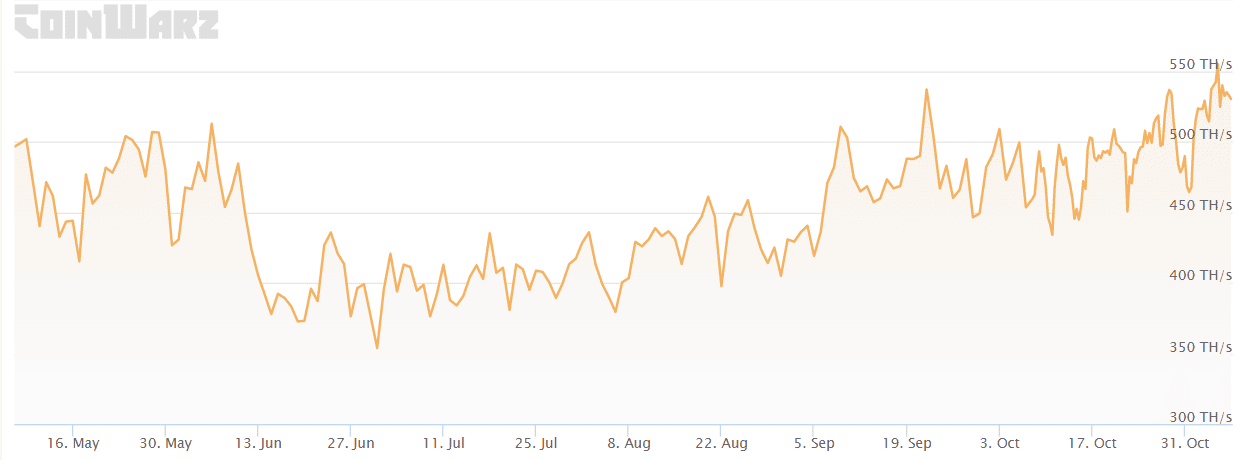
Interestingly, LTC’s mining community could be the reason for this surge as LTC’s hashrate witnessed a significant surge recently. Data from CoinWarz revealed that LTC’s hashtag was increasing consistently over the past few months. At press time, LTC’s hashrate stood at at 522.19 TH/s. Furthermore, as a result of the hike in LTC’s hashrate, its mining difficulty also followed the same path and went up lately.
A quick glance at the metrics…
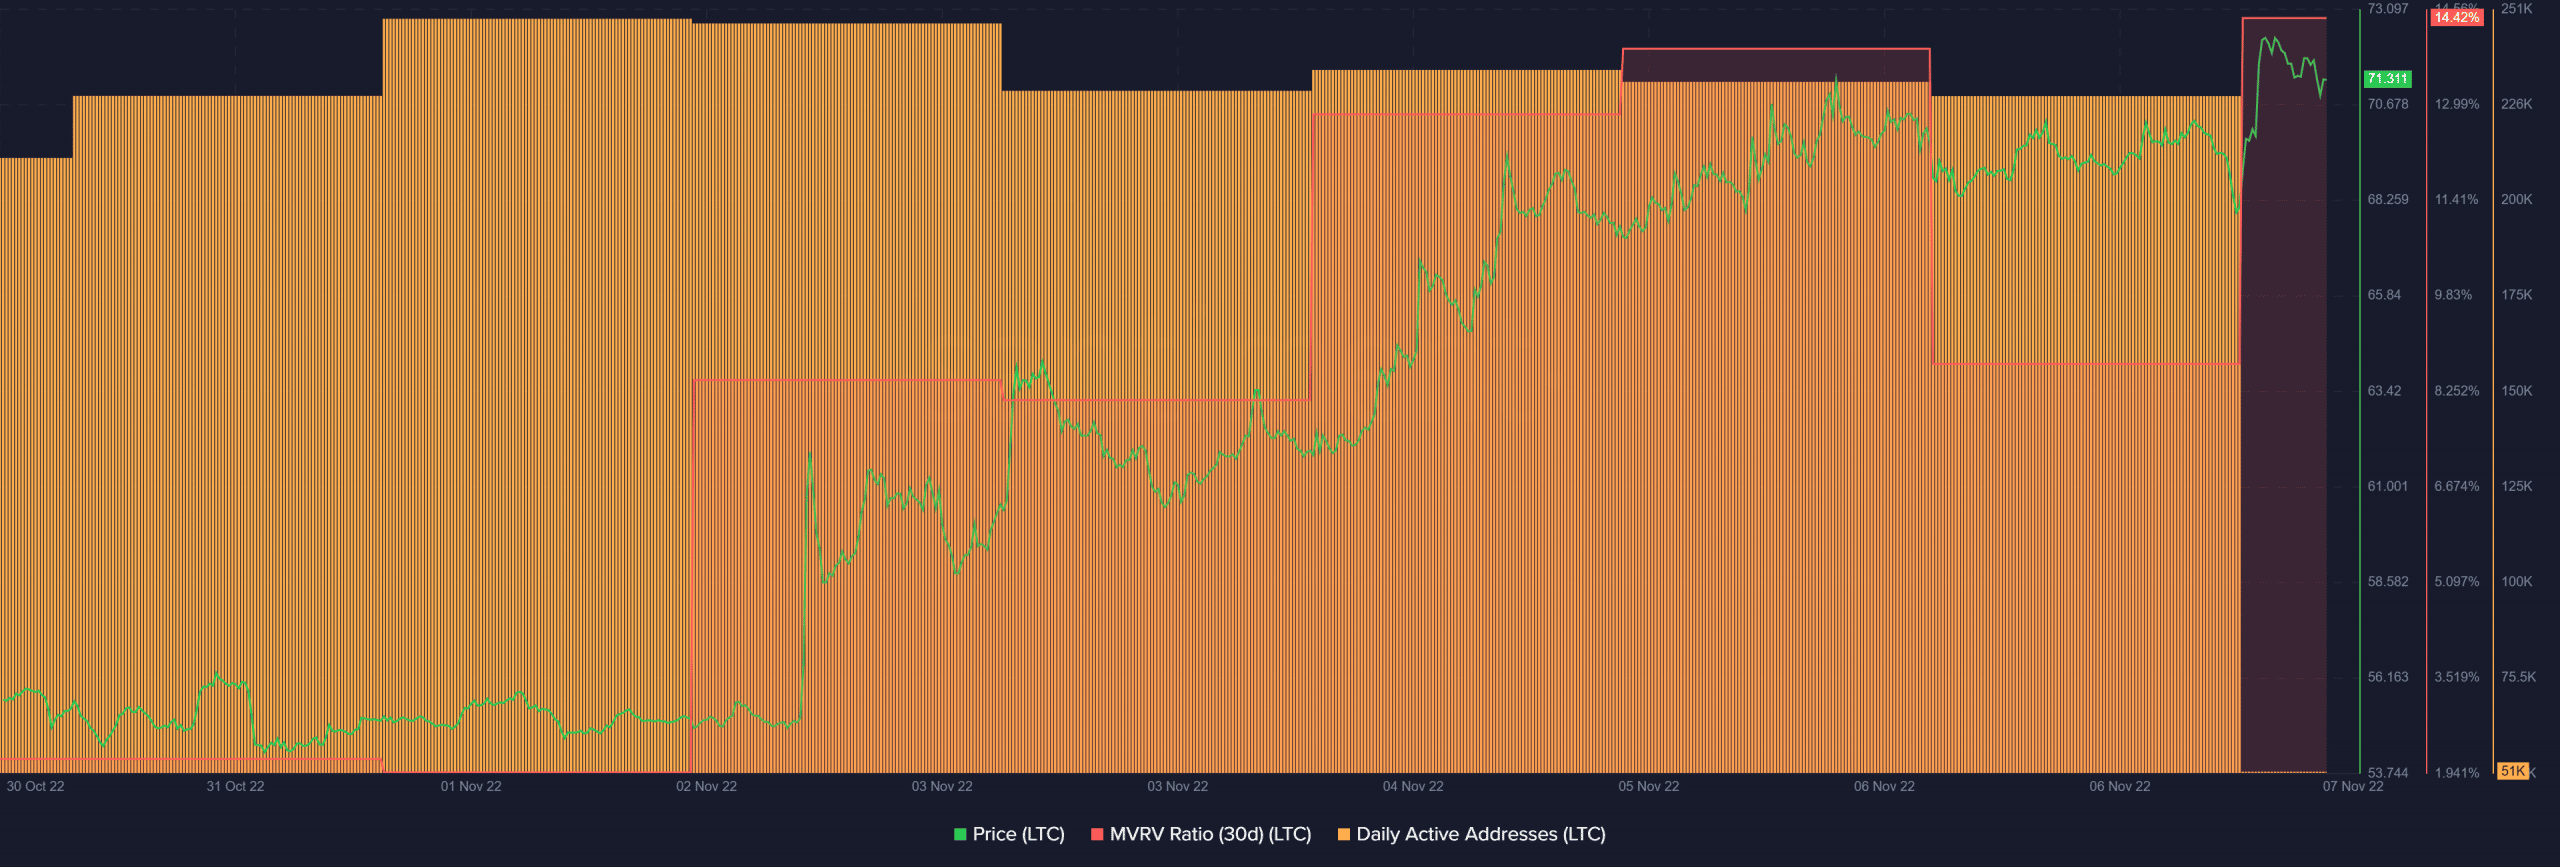
Thanks to the ongoing price pump, some on-chain metrics were in favor of LTC, as they suggested a continued uptrend in the coming days. LTC’s Market Value to Realized Value (MVRV) ratio was up, which was a positive signal for the network.
Moreover, LTC’s daily active addresses also witnessed a consistent high, thus indicating a stable number of users on the network.
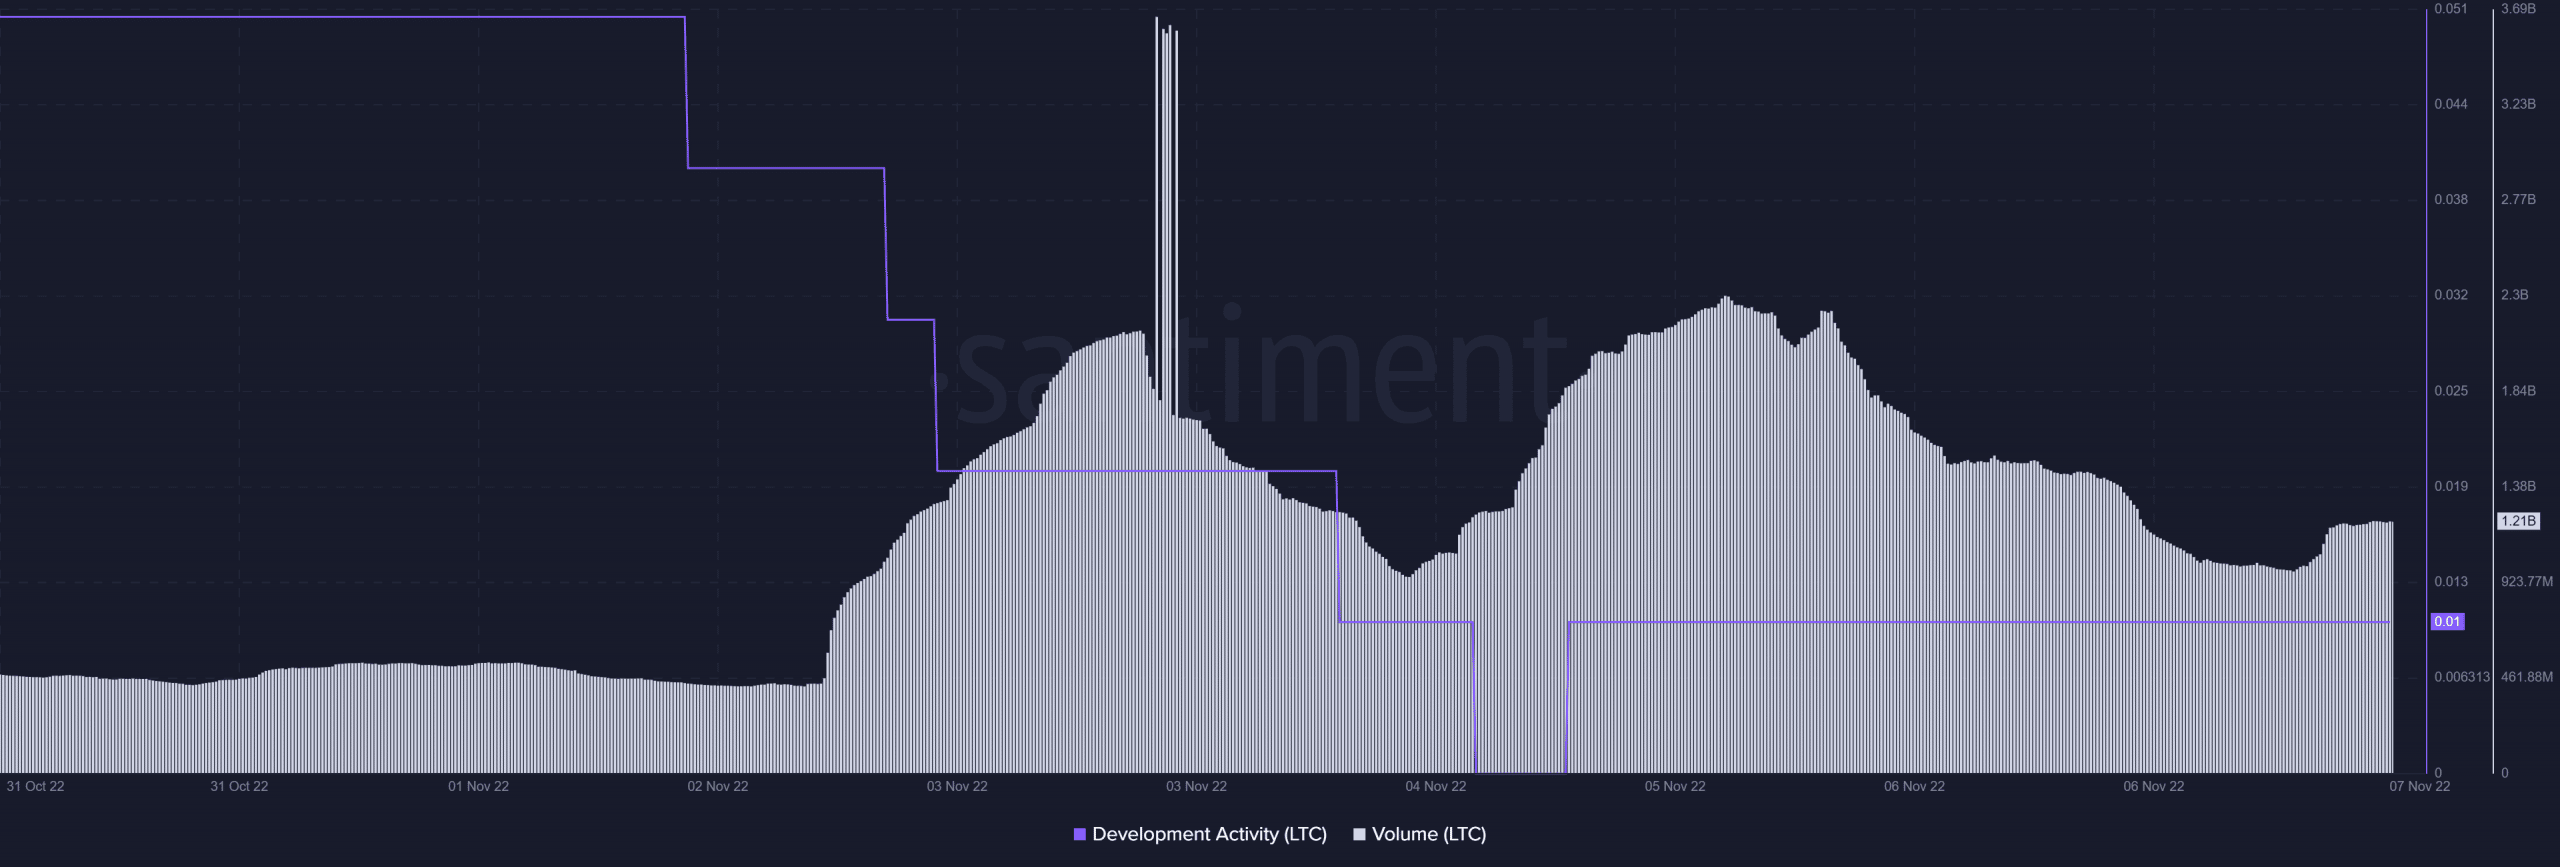
However, the rest of the metrics planned to move in the opposite direction. This could be a matter of concern for investors. For instance, LTC’s development activity went down sharply over the last week, which was a negative signal for the blockchain.
Moreover, despite the hike in LTC’s price, its volume registered a decline in the past few days. Glassnode’s data revealed that Litecoin’s reserve risk spiked lately. This also indicated that it was not the right time for investors to accumulate.
This is what LTC traders can expect
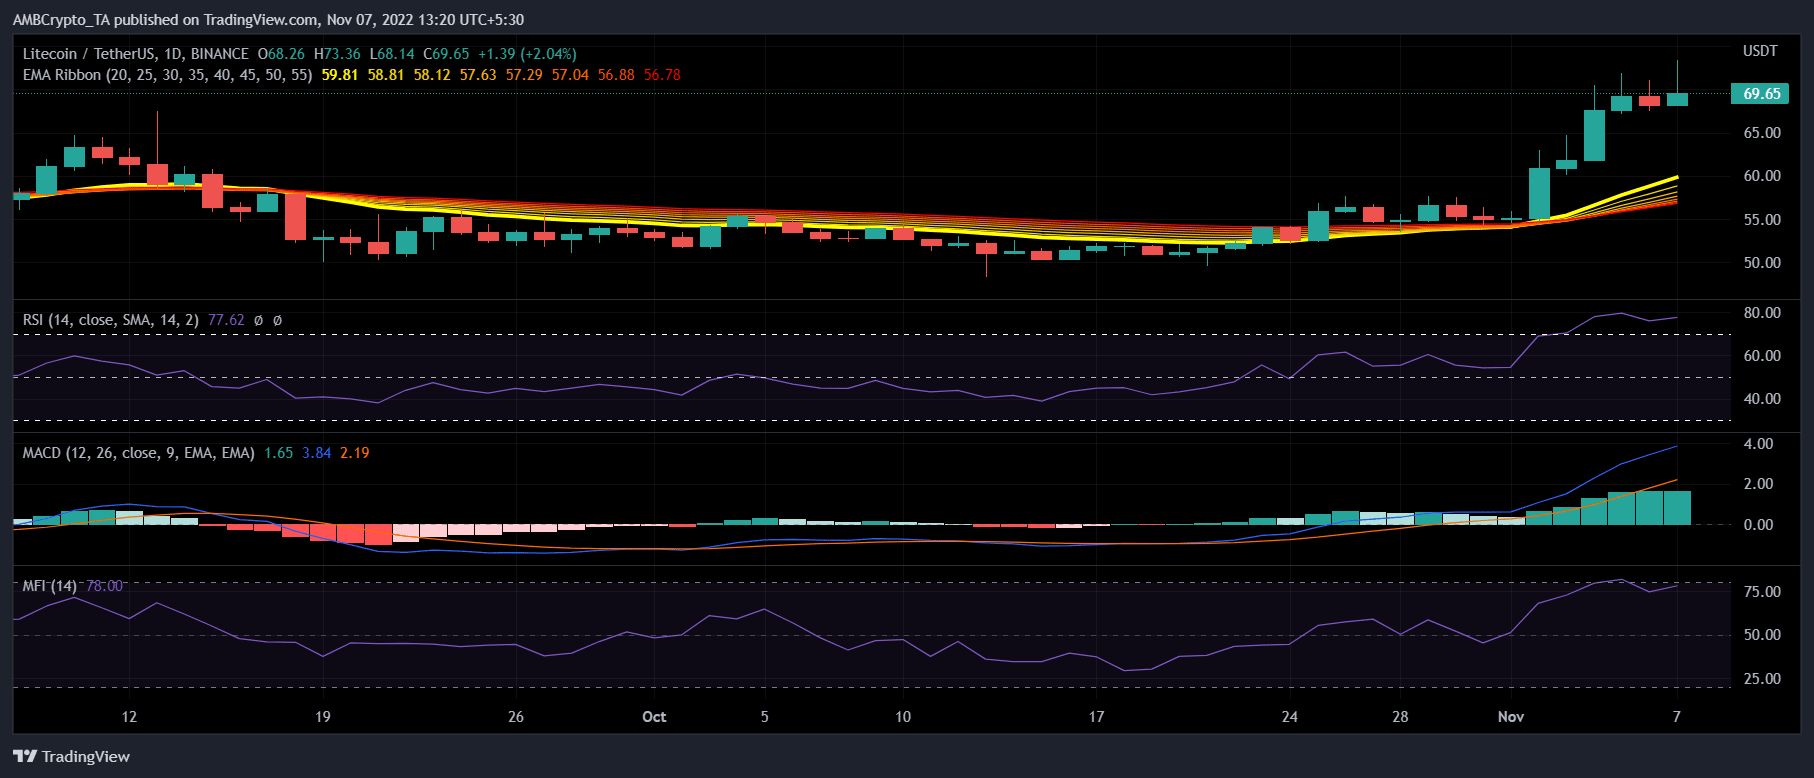
A look at LTC’s daily chart painted a bullish picture for the coin as most of the market indicators suggested a continued uptrend in the coming days. Examplar, the Exponential Moving Average (EMA) Ribbon revealed buyers’ advantage in the market. The Moving Average Convergence Divergence (MACD)’s reading complemented that of the EMA Ribbon, as it too indicated that the bulls had an edge over the bears.
However, the Relative Strength Index (RSI) was in the overbought zone, which meant that a trend reversal could be on the way. Moreover, the Money Flow Index (MFI) also registered an uptick and headed towards the overbought zone.


