Chainlink, NEO, Cosmos Price Analysis: 05 October

The cryptocurrency market was mostly seen consolidating over minor losses and gains in the last 24 hours. Some coins such as Chainlink and NEO appreciated slightly, whereas Cosmos was seen declining on its charts.
LINK demonstrated resurfacing of positive buying pressure and NEO noted an increase of 2% with chances of trading near its immediate price ceiling. ATOM was bearish with buying strength struggling to move into the bullish zone.
Chainlink (LINK)
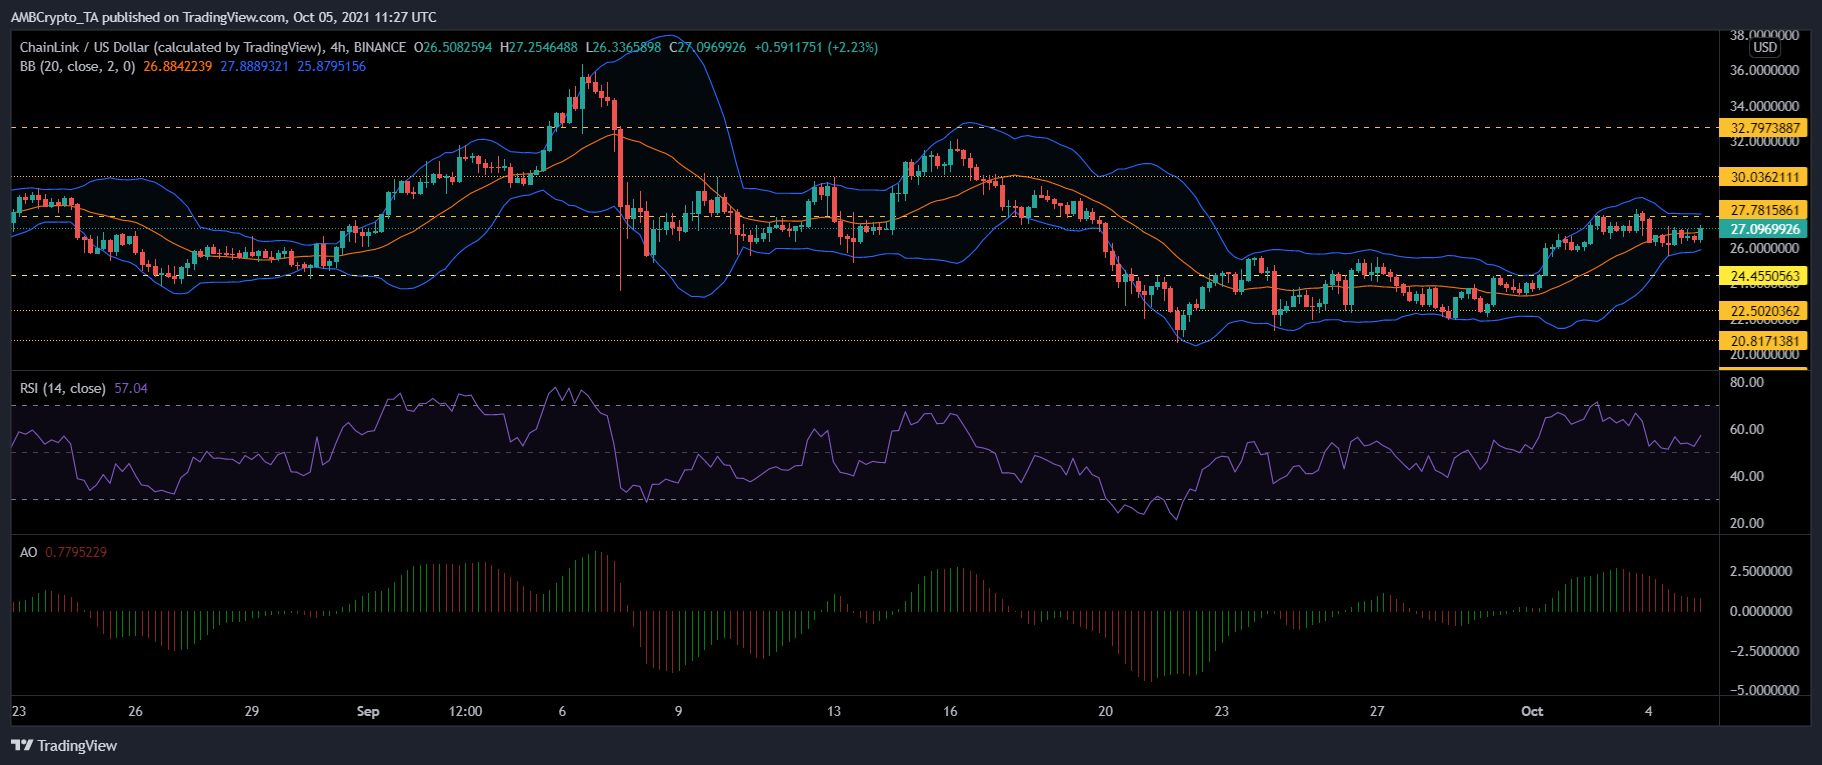
Chainlink was priced at $27.09 and it was seen trading laterally. It gained 1.1% over the last 24 hours. Buying strength recovered slightly which suggested that prices could move up north. The overhead resistance was at $27.78 and then at $30.06. Technical indicators pointed towards mixed signals.
The Relative Strength Index was seen displaying an uptick, but buying pressure still remained within the bullish territory. The Awesome Oscillator flashed red signal bars. The Bollinger Bands are running in a narrow range, which hinted at lowered price volatility.
If LINK continued to consolidate over the next trading session, the price of the altcoin could move down. The support line for the coin stood at $24.45 and then at the token’s one week low of $22.50. The other price floor was at $20.81.
NEO
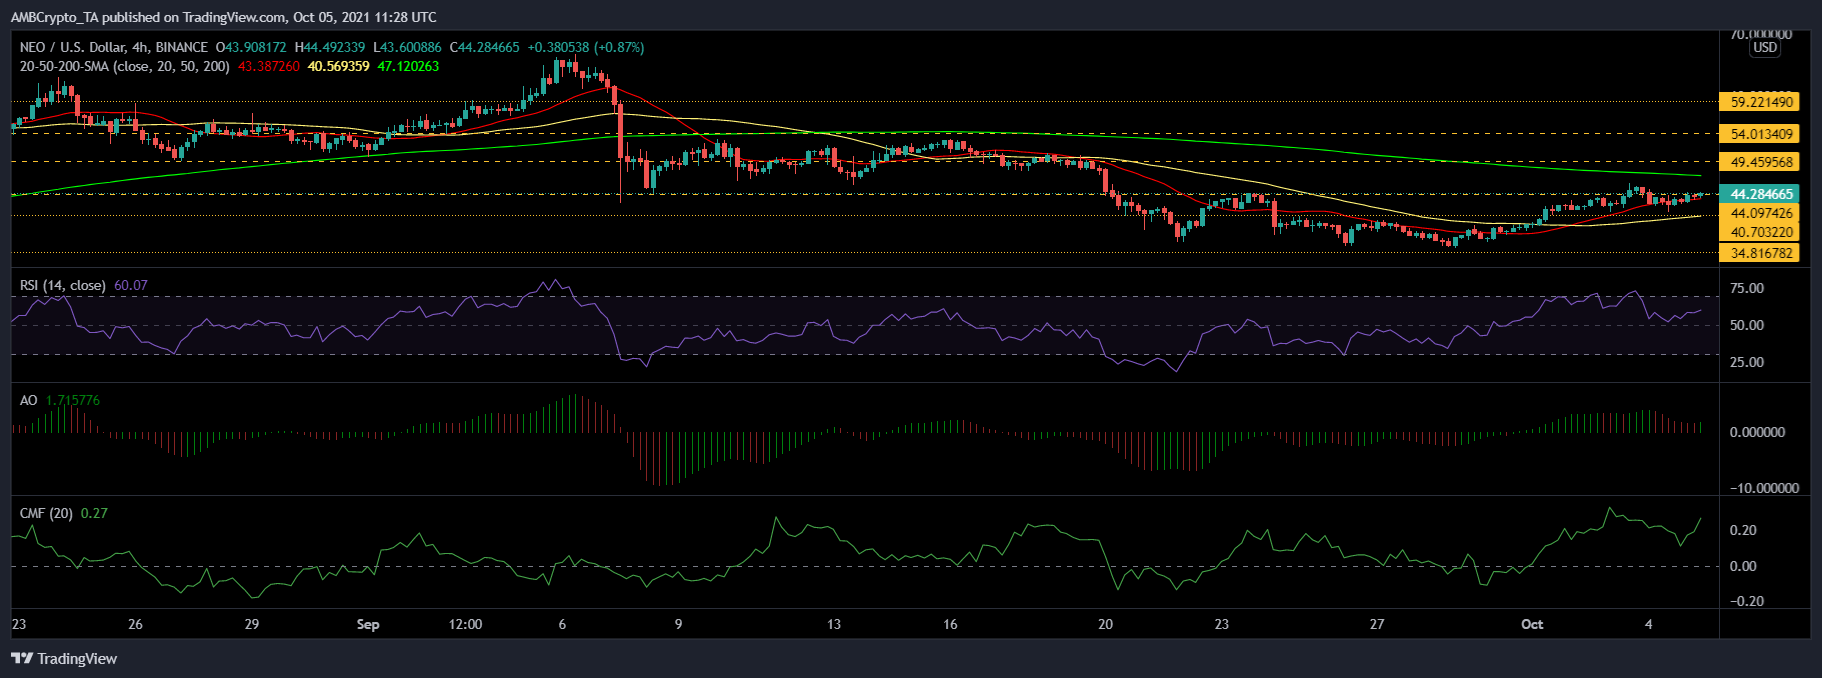
NEO was up by 2% over the last 24 hours and was trading at $44.28. The altcoin should attempt to trade near the resistance mark of $49.45, moving above which it could find itself near $54.01 and then at $59.22. The latter marked a multi-week high for the coin. On the four-hour chart, the altcoin’s price stood above the 20-SMA line which meant that price momentum was with the buyers.
The Relative Strength Index noted an uptick and neared the 60-mark which suggested strong buying pressure. The Awesome Oscillator displayed one green signal bar that pointed towards the last trading session being in the green. Chaikin Money Flow was also seen above the half-line as capital inflows remained positive.
On the flip side, the immediate support line for the coin was at $44.09. Other price support levels for the coin were at $40.70 and $34.81.
Cosmos (ATOM)
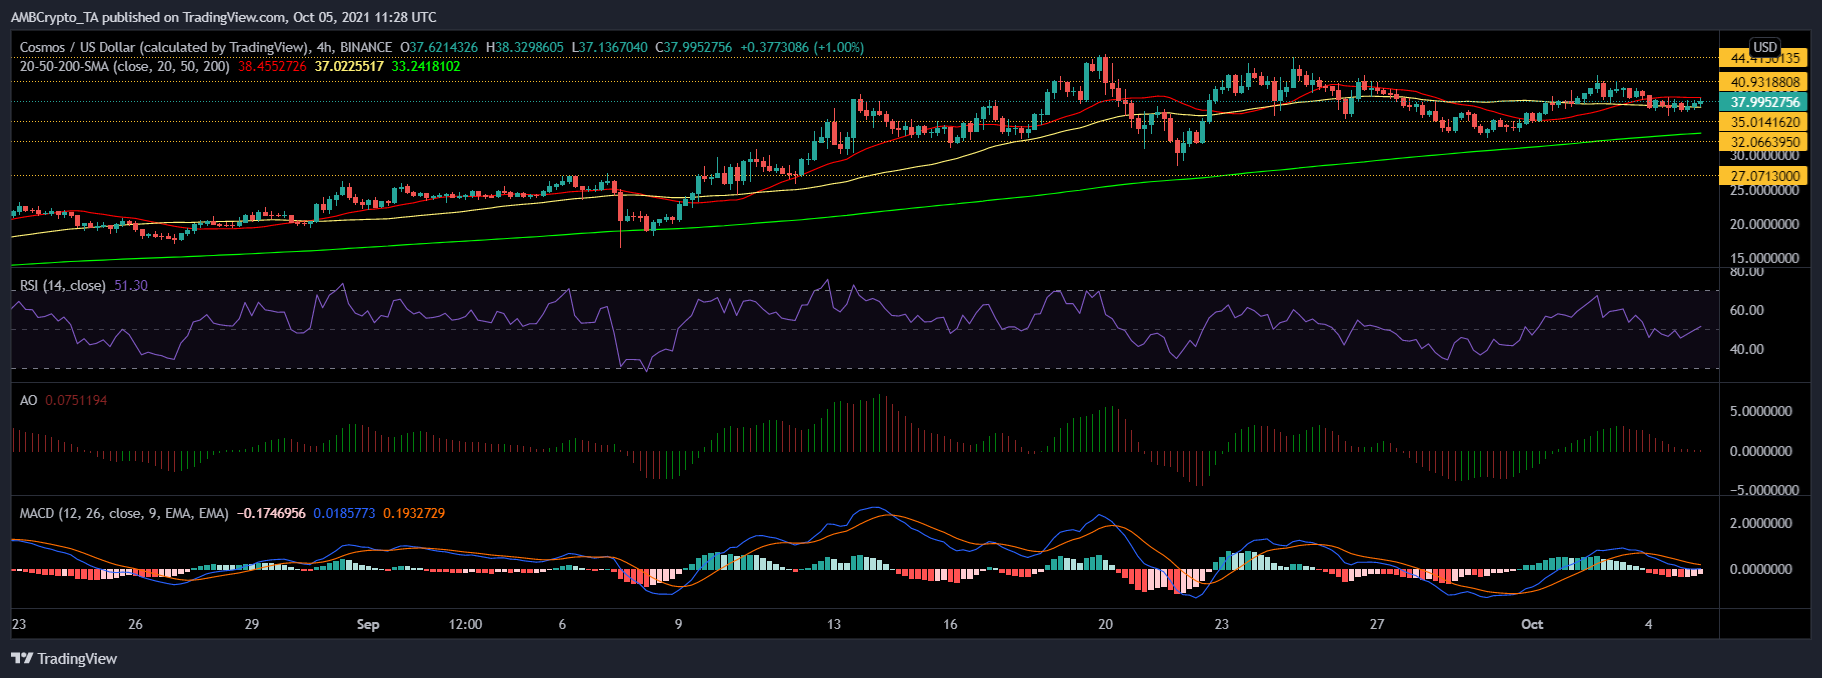
Cosmos has been moving at the current price level for the last 24 hours. It was available for $37.99. Indicators displayed that buying pressure had fizzled out and that the bears had taken over. The nearest support line for the coin was at $35.01 and then at $32.06.
The other price floor was $27.07. The four-hour 20-SMA line was also above the candlesticks which indicated that price momentum was with the sellers.
The Relative Strength Index was struggling to move over the half-line. The Awesome Oscillator displayed red signal bars. The MACD was also bearish with red bars on its histogram.
In a reverse scenario, price resistance for ATOM was at $40.93 and then $44.41, respectively.