Chainlink, Solana, NEO Price Analysis: 03 September

The likes of Chainlink, Solana, and NEO have all recorded diverse price actions over the last 24 hours. LINK revisited a multi-month high after appreciating by 2.5% while Solana was one of the market’s biggest gainers.
In fact, the altcoin rallied by over 22% and eyed its psychological price ceiling of $150. NEO, conversely, pictured consolidation, trading close to a one-week high.
Chainlink [LINK]
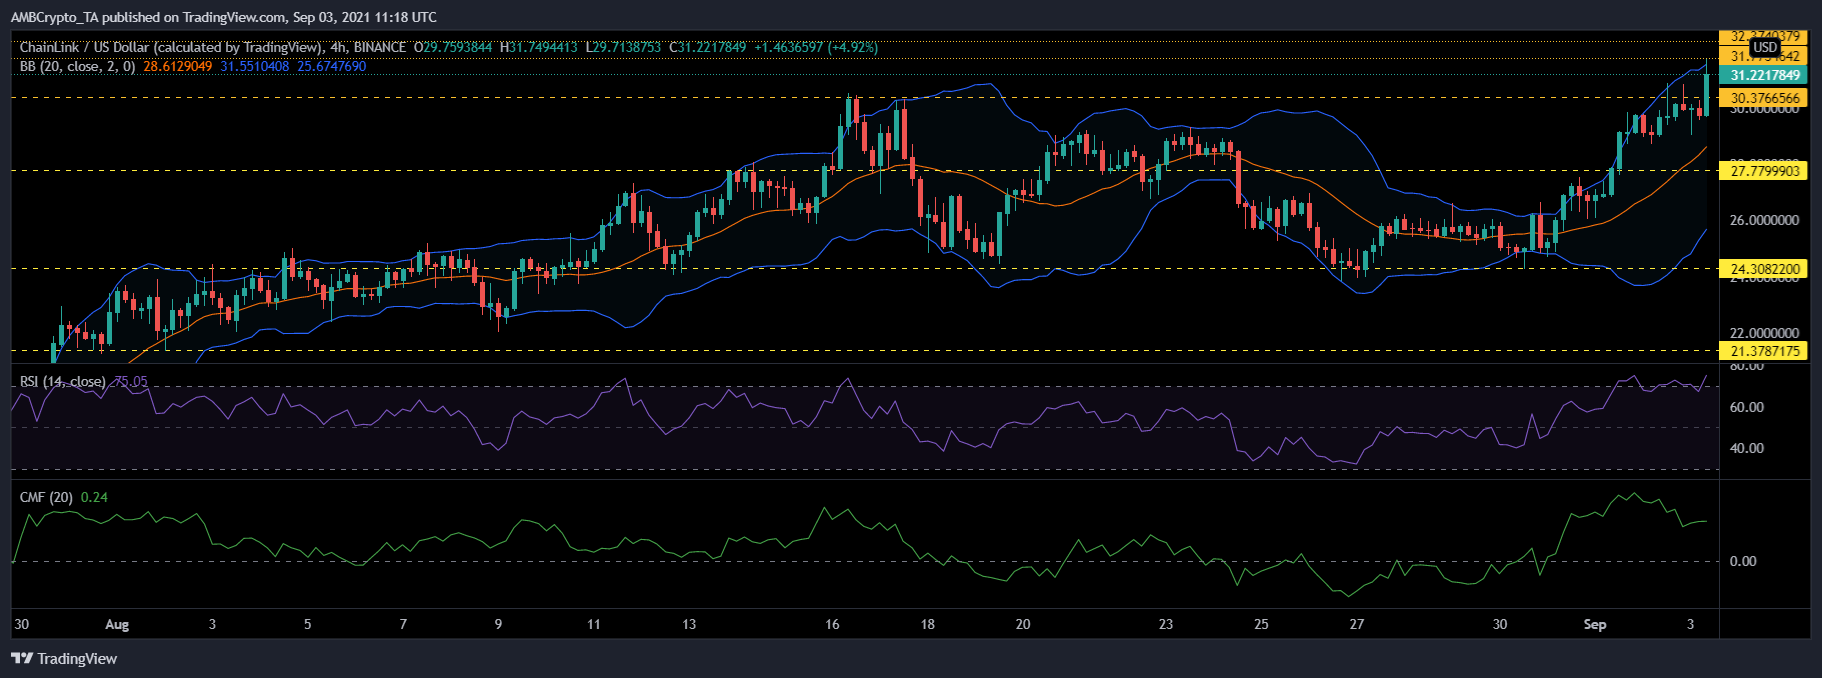
Chainlink’s chart presented an uptrend, with the altcoin having risen by 2.5% over the last 24 hours. The press time price level marked a three-month high for the crypto. Its immediate resistance level stood at $31.77, with the next at $32.47.
Buying strength remained consistently high as the Relative Strength Index was seen inside the overbought territory. Capital inflows have also been on the rise since the beginning of September. Chaikin Money Flow reflected the same by staying above the half-line.
Bollinger Bands were diverging over the course of the upswing in prices. This indicated that price volatility could be on the rise over the next few trading sessions.
A flip below would mean LINK resting at $27.77, which, however, has acted as a propelling point for prices over the last month. In case LINK drops below the aforementioned level, it could trade near the $24.30 price support.
Solana [SOL]
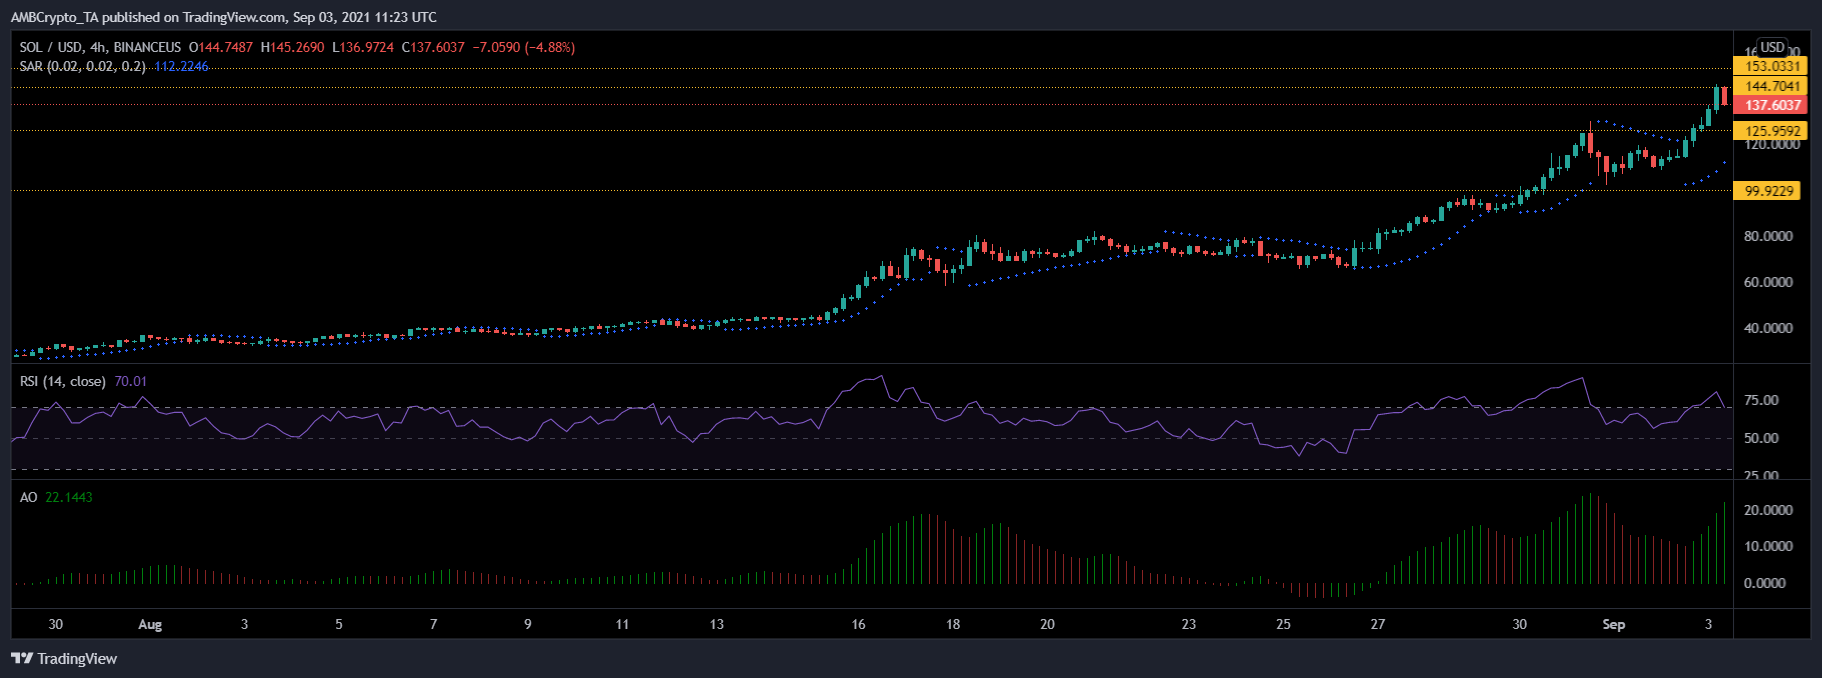
Solana was priced at $137.60, having climbed by 22.2% over the last 24 hours. The psychological resistance for SOL was at $153.03. With more rallies, the alt could attempt to trade near the aforementioned price hike. Parameters exuded extreme bullishness in the market.
Solana continues to create all-time highs and remained overvalued, at the time of writing. Relative Strength Index was well above 75. However, it could fall through that level if SOL loses momentum. Awesome Oscillator’s green signal bars looked amplified. Parabolic SAR also registered an uptrend through dotted lines spotted below the candlesticks.
A price pullback would make SOL trade around the $125.95 support line and then on $99.92. The latter price level has acted as a kickstart point for SOL’s price rallies in the past.
NEO
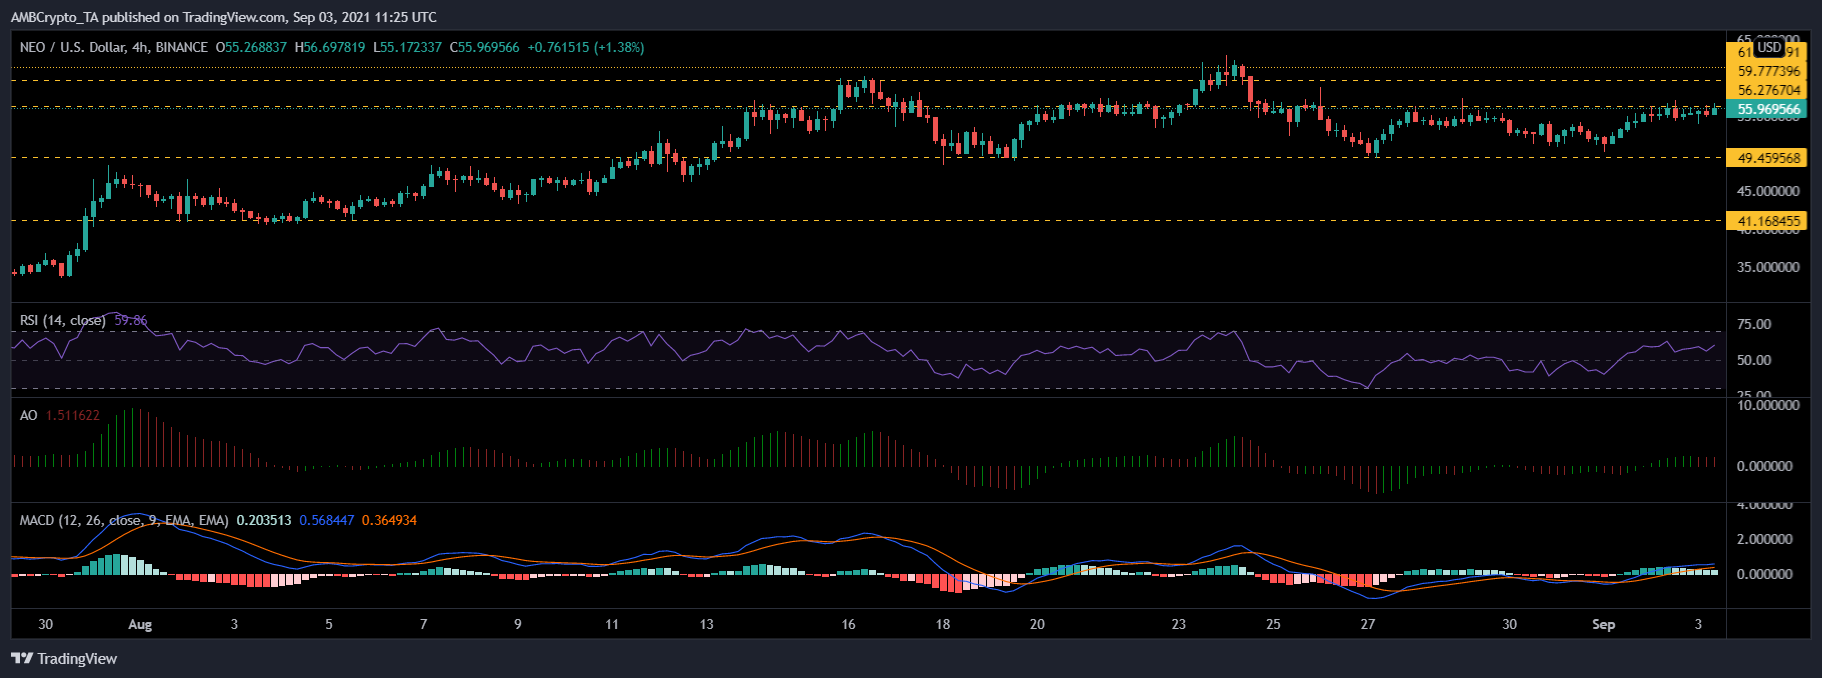
NEO exhibited consolidation on its four-hour chart and also lost 0.7% of its value over the last 24 hours. It was trading at $55.96, which also made NEO revisit its weekly high price level. In case NEO breaks the consolidation on the upside, it could topple the $56.27 price resistance. Moving further up, NEO could attempt to revisit the multi-month high of $61.77.
Buying pressure remained in the market and the Relative Strength Index rested near 60.
MACD continued to display green signal bars although it seemed to recede over the last few trading sessions. Finally, the Awesome Oscillator pictured red signal bars.
NEO’s consolidated trading could push the price below to fall near the $49.45 support. The altcoin hasn’t dipped below the $49.45 price line for three weeks now. Failing to sustain itself above the same could drag NEO to $41.16.


