Ethereum, Binance Coin, Chainlink Price Analysis: 12 July

Last week, most major altcoins were trading the in the red. However, this week, even though the broader market showed mixed signals, some altcoins performed relatively better. Ethereum stayed above $2000 and moved much further up from its support level of $1753, Binance Coin was on an uptrend, and Chainlink, despite opening the market in green, remained mostly sluggish today.
Ethereum (ETH)

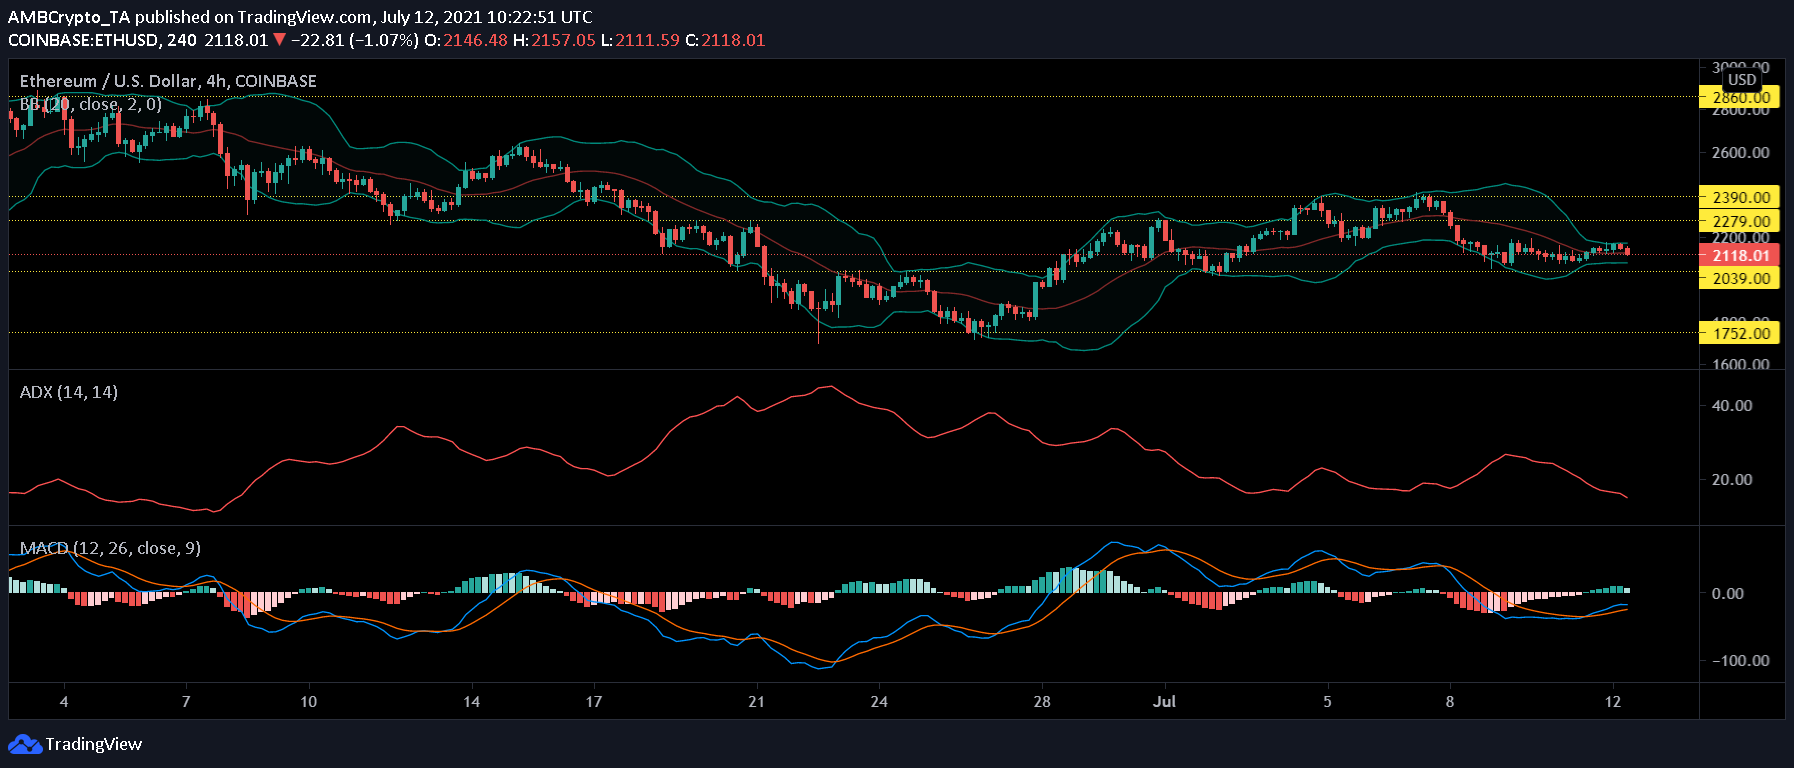
ETH/USD, TradingView
Ethereum was able to stay above the $2000 price level, trading at $2118 at press time. It stayed just above its crucial support system of $2039. A bullish momentum looked possible, as the altcoin registered a 2.8% rise in prices over the last 24 hours. A break above the crucial resistance of $2390 would be possible if the bulls thrust the prices further up, over immediate trading sessions.
The bullish signal on the MACD indicator, after a bullish crossover that occurred on July 11, could propel the price action northward. The drastic convergence of the Bollinger Bands signified that market volatility would remain on the lower side but the price action may soon expect a breakout of sorts.
The Average Directional Index still indicated market weakness with sideways price action, but with the prices ascending the reading may change, going forward.
Binance Coin (BNB)

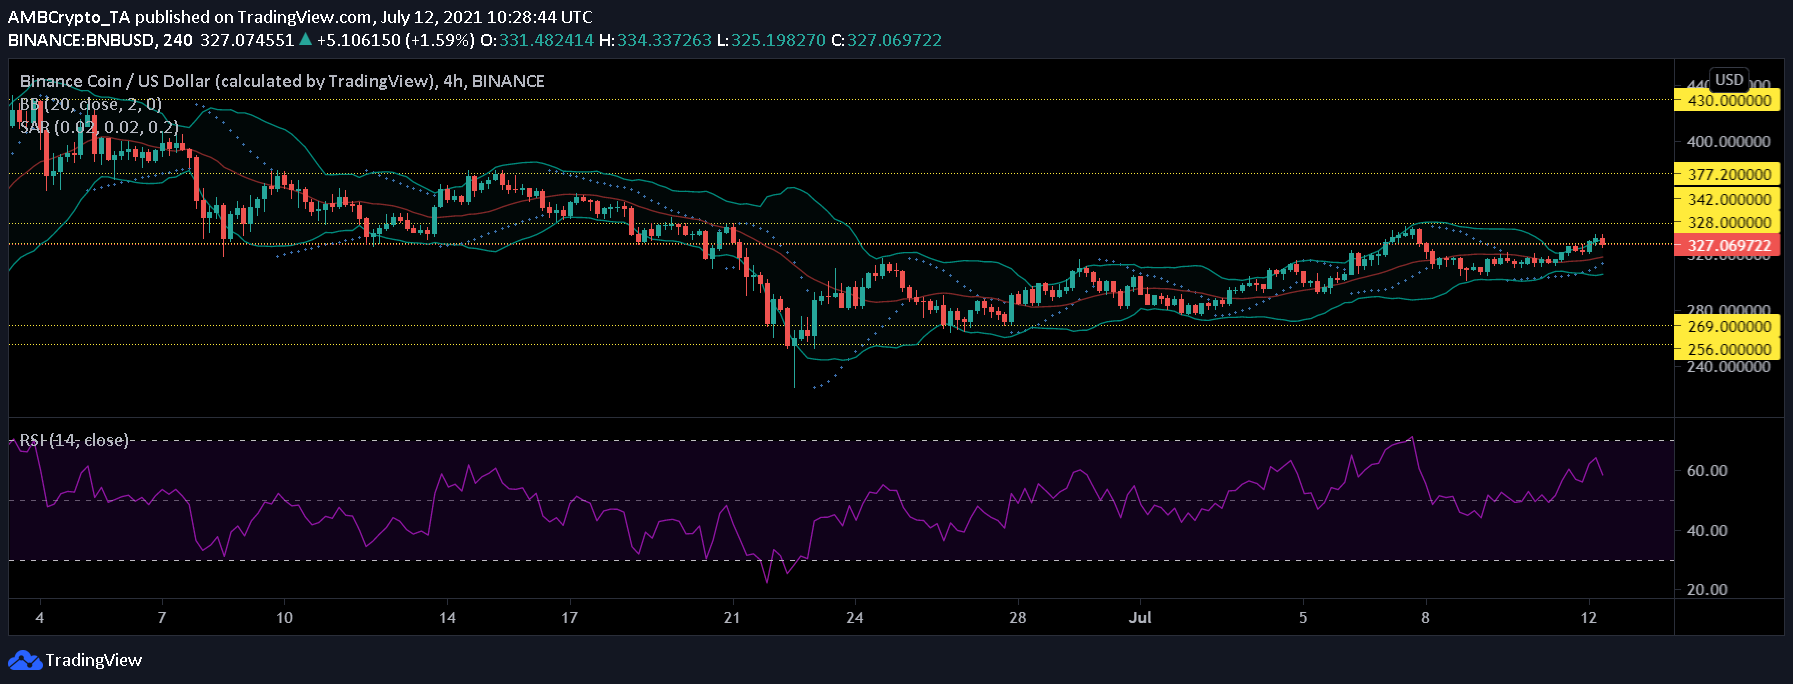
BNB/USD, TradingView
Binance Coin resumed its uptrend; the token was on its way to cross the resistance level of $328 as at press time, it was changing hands at $327.06. BNB was oscillating between the $270 and $328 support and resistance levels respectively, over the past weeks. In case of a hike, it may easily break past the $342 level.
Relative Strength Index observed a downtick at the time of writing, signifying that buying pressure decreased over selling pressure. Bollinger Bands diverged indicating market volatility may increase and prices may fluctuate slightly.
With prices going up, the Parabolic SAR noted an uptrend with the dotted lines arranging themselves underneath the candlesticks.
Chainlink (LINK)

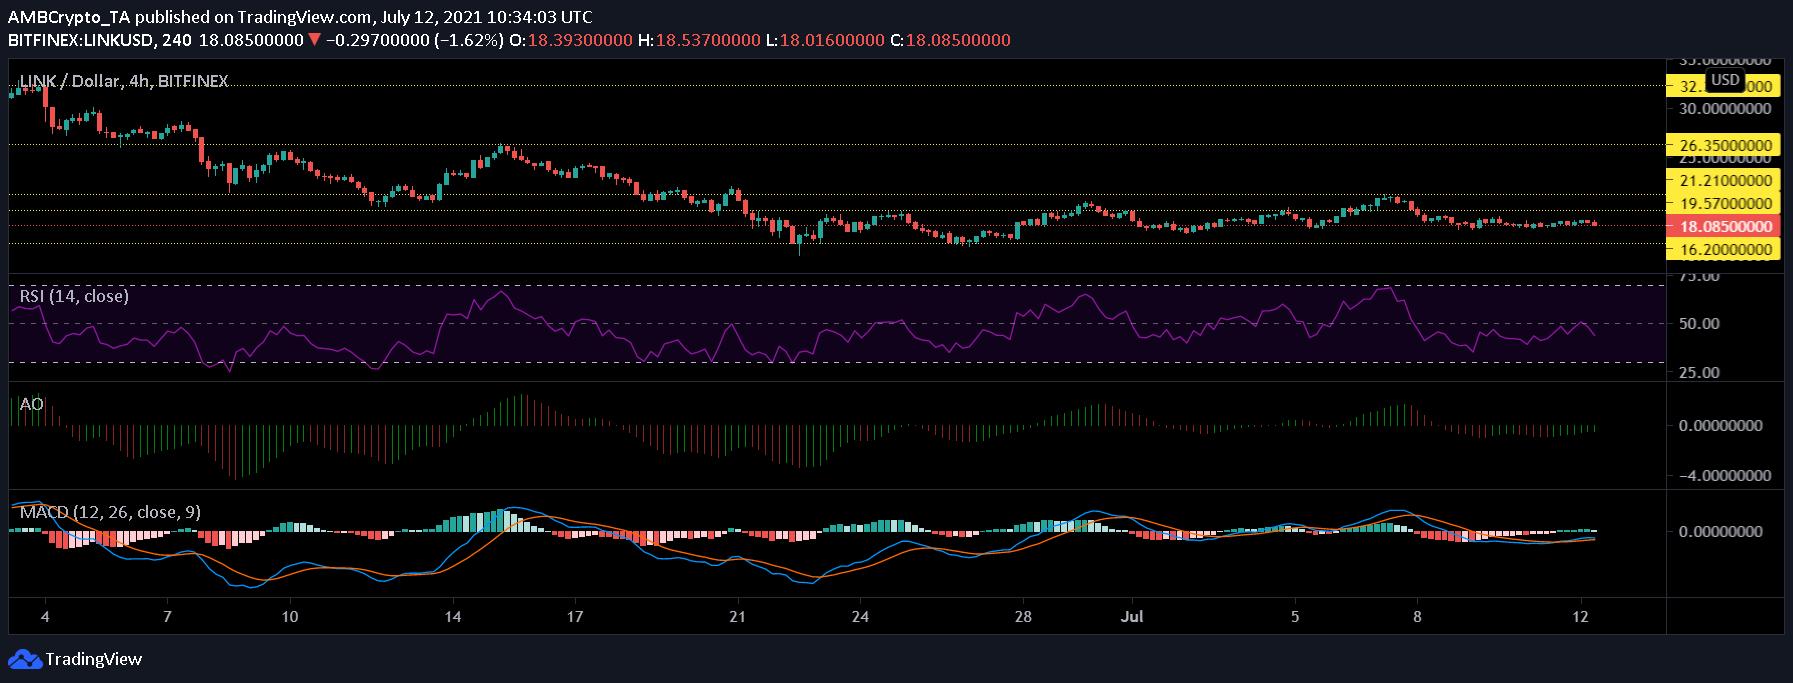
LINK/USD, TradingView
Chainlink’s prices were consolidating for a while now, suggesting a stagnant price action. LINK was valued at $18.08 on the back of a 2.8% increase in prices in the last 24 hours. With a market capitalization of $8.047 billion, the alt was ranked 15 on CoinGecko.
The buying pressure was less as Relative Strength Index remained below the centerline and also noted a small decrease. Despite a bullish crossover, a short-term bullish signal observed on the MACD indicator may not be enough to hike up the prices and put the coin’s price action outside its constricted range. The indicator’s reading confirms a trendless price action.
The Awesome Oscillator displayed bullish signals, but at the time of writing, these signal bars started to decline. In case of bearish pressure mounting in the next trading sessions, the token may fall to the support level of $16.2.


