Ethereum Classic, VeChain, Tezos Price Analysis: 04 October

Altcoin industry depicted mixed trading sessions with some coins losing their value and others securing fresh all time highs. Ethereum Classic dipped and was nearing its immediate support level, VeChain also fell by 6.2% and could go back to trading at a level it last traded in the beginning of this month. Tezos on the contrary, brought in a fresh all-time high a few hours back with chances of a pullback still remaining.
Ethereum Classic (ETC)
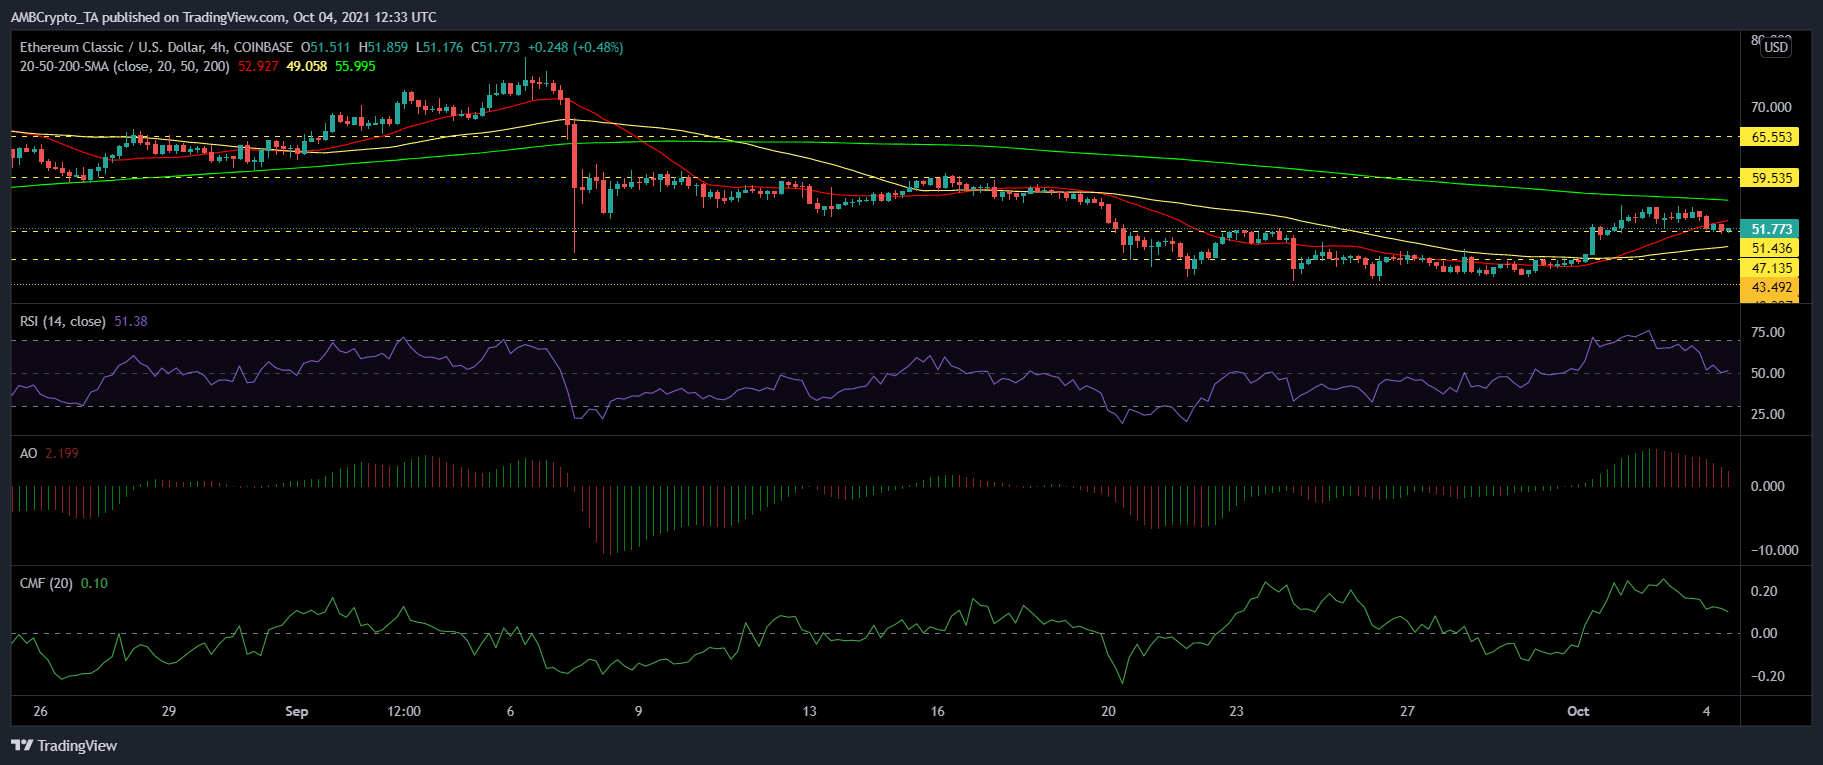
Ethereum Classic fell by 4.1% over the last 24 hours and was priced at $51.77. The immediate support level for ETC was at $51.46, the fall beneath which could push prices down to $47.13 and then at $43.49.
On the four-hour chart, ETC’s price was below the 20-SMA which meant that price momentum was inclined towards sellers in the market. Key technical indicators also pointed towards a negative price action.
The Awesome Oscillator displayed red signal bars. The Relative Strength Index also fell, although the indicator was within the bullish zone. The Chaikin Money Flow was also above the half-line which meant that capital inflows were still positive.
If buying strength recovers, the coin’s prices can go up and could trade near the $59.53 resistance mark. The other price ceiling stood at $65.55.
VeChain (VET)
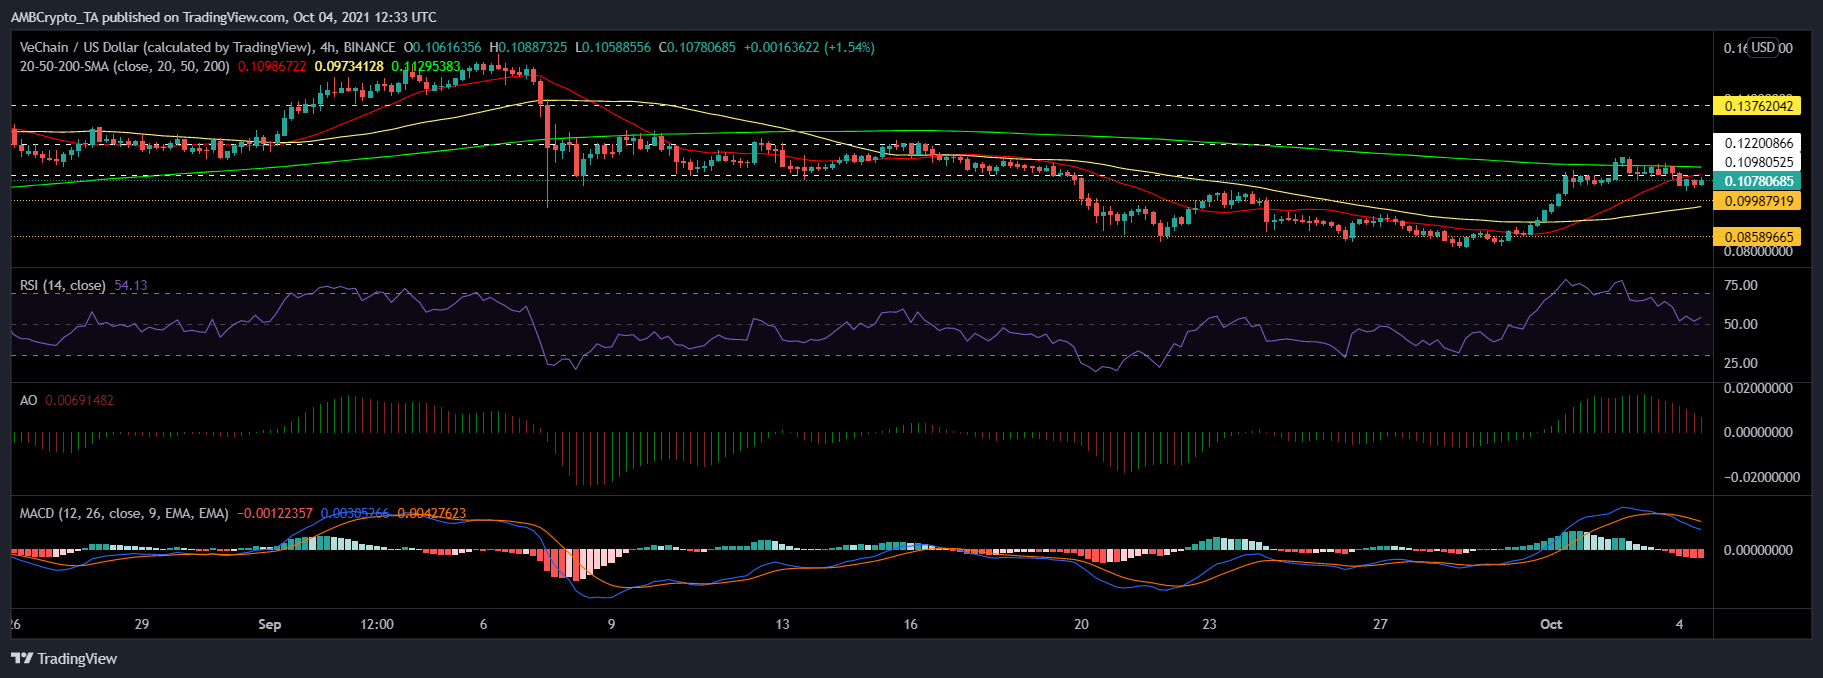
VeChain declined by 6.2% over the last 24 hours and it was priced at $0.107. The nearest support line for the altcoin stood at $0.099, dipping below which VET could revisit $0.085, which the coin last traded around four days back.
The altcoin had witnessed price revival since the beginning of this month, as buying strength re-entered the market. The recent dip was caused due to buyers exiting the market.
On the four-hour chart, the price of the altcoin was below the 20-SMA line, which indicated that price momentum was in favour of sellers. The Relative Strength Index noted an uptick although it remained quite close to the half-line.
MACD displayed a bearish crossover and flashed red bars on its histogram. The Awesome Oscillator flashed red histograms.
On the reverse, if VET’s price rises, the overhead resistance line stood at $0.109. The additional price ceilings that the coin can encounter was at $0.122 and $0.137.
Tezos (XTZ)
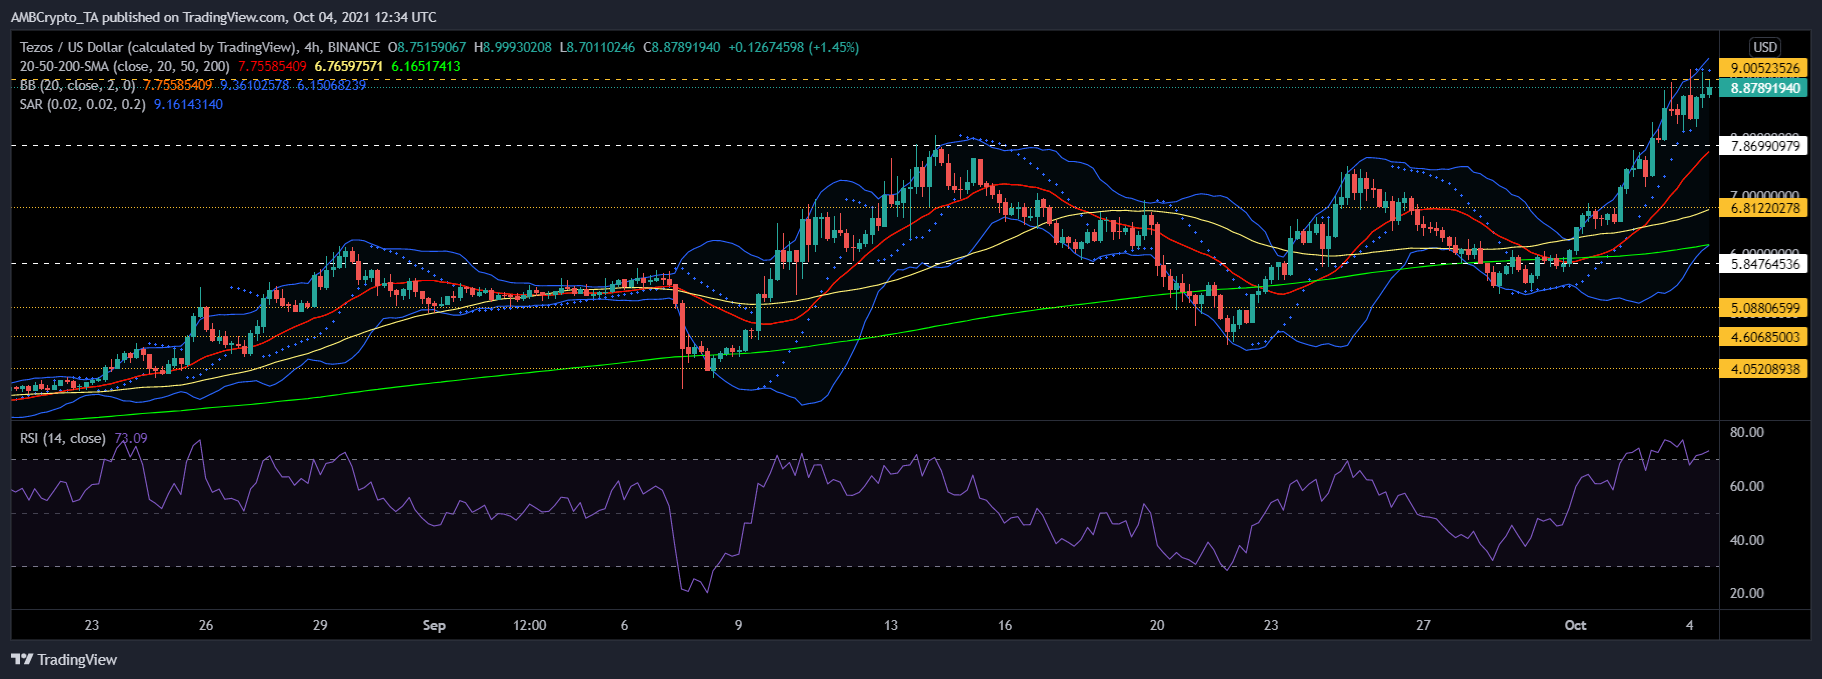
Tezos noted an uptick as it was priced at $8.87 after rallying nearly 3.7% over the last 24 hours. The coin had recently secured an all-time high and moving upwards it could retest the same. The psychological resistance region for the coin currently stands at $10.
Outlook on the chart displays positive price action. On the four-hour 20-SMA, the price of XTZ was above it which was a sign of the price momentum being in inclination with buyers. The Relative Strength Index was positioned above the overbought zone.
Bollinger Bands were wide as price volatility could see a rise over the next trading sessions. Conversely, Parabolic SAR’s dotted lines were visible over the candlesticks which meant a downtrend.
In case the above notion holds true, a correction would push XTZ to trade near its support line of $7.86 and then at $6.81. Other price floors rested at $5.84 and $5.08 respectively.