How this support zone may hold the key to Bitcoin’s short-term movement

Disclaimer: The findings of the following analysis are the sole opinions of the writer and should not be taken as investment advice
Bitcoin’s latest retracement from $42,000 has been an interesting talking point in the market. On-chain metrics showed that the king coin faced a circulating supply problem, with its NVT ratio close to an all-time low. Even though the ratio did show signs of a reversal, however, some continue to back the possibility of an extended BTC decline.
On the other hand, those who are optimistic seem to ignore such signals and believe that the price might reverse within a key support zone. The question is – Which assumption is more accurate?
At the time of writing, BTC was trading hands at $38,400, with bears maintaining an edge over market proceedings.
Bitcoin 4-hour Chart
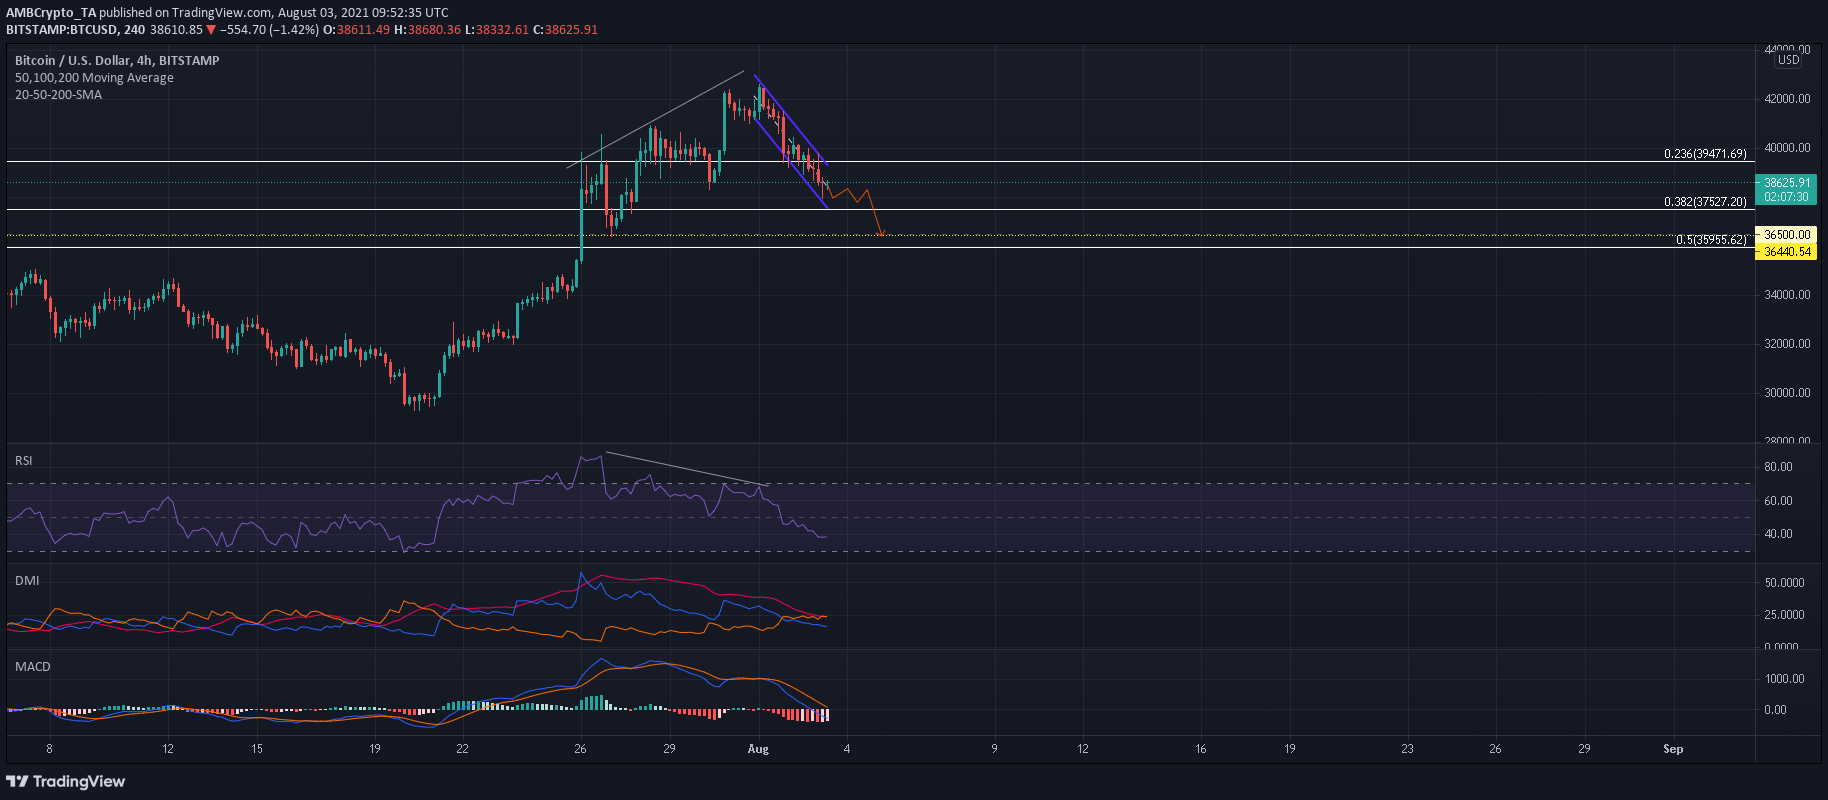
The Fibonacci tool was used to highlight potential support levels resulting from BTC’s rebound from $30,000 to its over 2-month high of $42,600. BTC’s ongoing pullback is now heading towards the 38.2% Fibonacci level present at $37,527 – A region that has been in play during minor rallies over the past few months.
Interestingly, the Visible Range’s POC lay slightly below this and at around $37,000. These two areas formed the next support for BTC’s downtrend and must be observed over the next few sessions. A fall below this zone would pull BTC down to its 27 July swing low of $36,386.
Reasoning
The Relative Strength Index formed a bearish divergence and dropped below 40 – A sign of bulls losing strength in the market. Moreover, the Directional Movement Index registered a bearish trend switch as BTC dropped below its Fibonacci level. The MACD also saw its first decline below the half-line since bulls took over on 22 July.
Conclusion
With bearish signals afoot in the market, the bulls have a small window to initiate a trend reversal in their favor. This could take place between the support zone of $37,000-$37,527. A close below this would drag BTC to its 27 July swing low of $36,386. From this level, the bears could initiate further drawdowns.


