LooksRare, ApeCoin, Zcash Price Analysis: 05 May

The crypto market saw a surge in the past 24 hours after Bitcoin bounced to $39.8k. LooksRare and ApeCoin saw a strong rally in the past two days as well. APE, in particular, could have reacted positively to the surge in interest from an Elon Musk tweet. In any case, the market structure for the altcoins analyzed is bullish on the lower timeframes.
LooksRare (LOOKS)
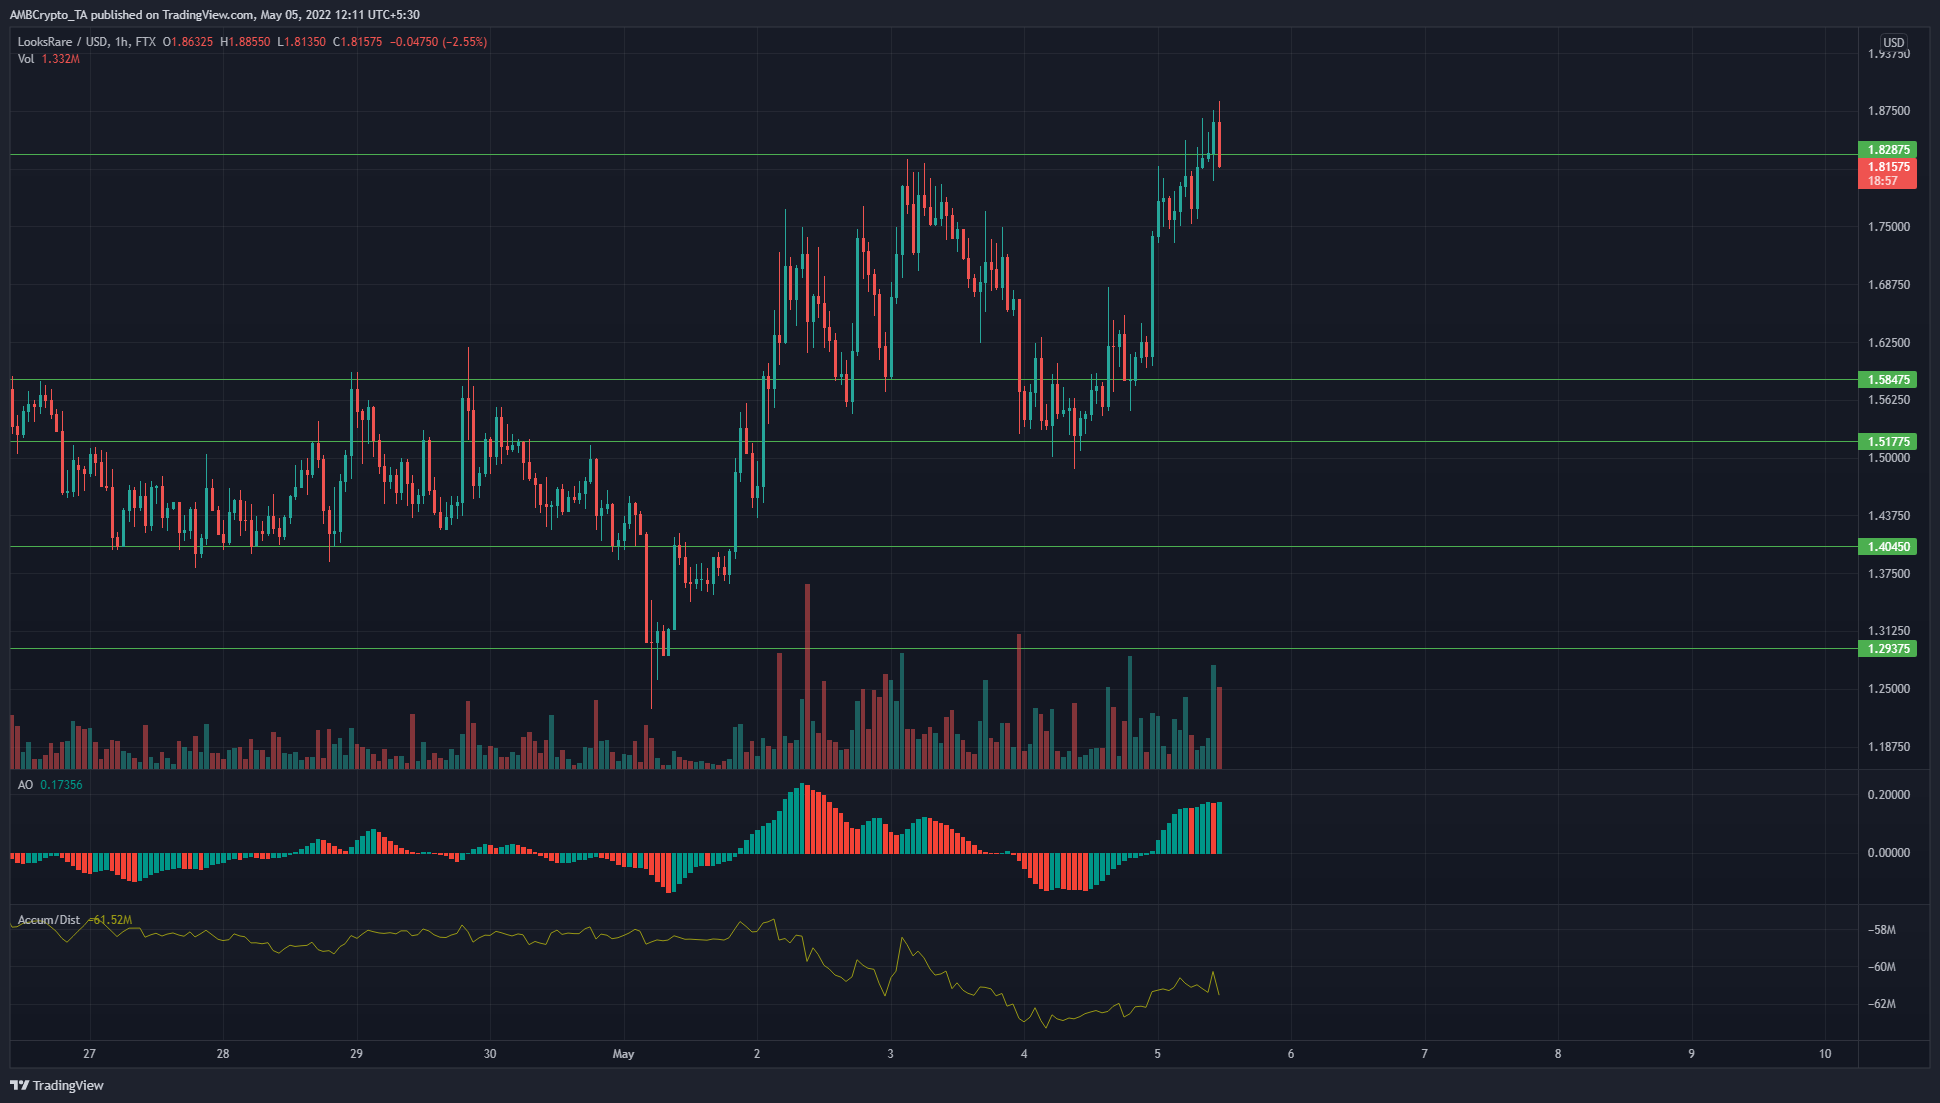
For LOOKS, the $1.29 level acted as support in the past week and the $1.4 level was also flipped from resistance to support. The Awesome Oscillator showed strong bullish momentum in the past couple of days.
Earlier this week, the A/D indicator was trending downward even as LOOKS surged from $1.56 to $1.75. In the past couple of days, the A/D has slowly begun to climb higher as it set a series of higher lows and higher highs. The $1.68-$1.75 area could offer a near-term buying opportunity for LOOKS.
ApeCoin (APE)
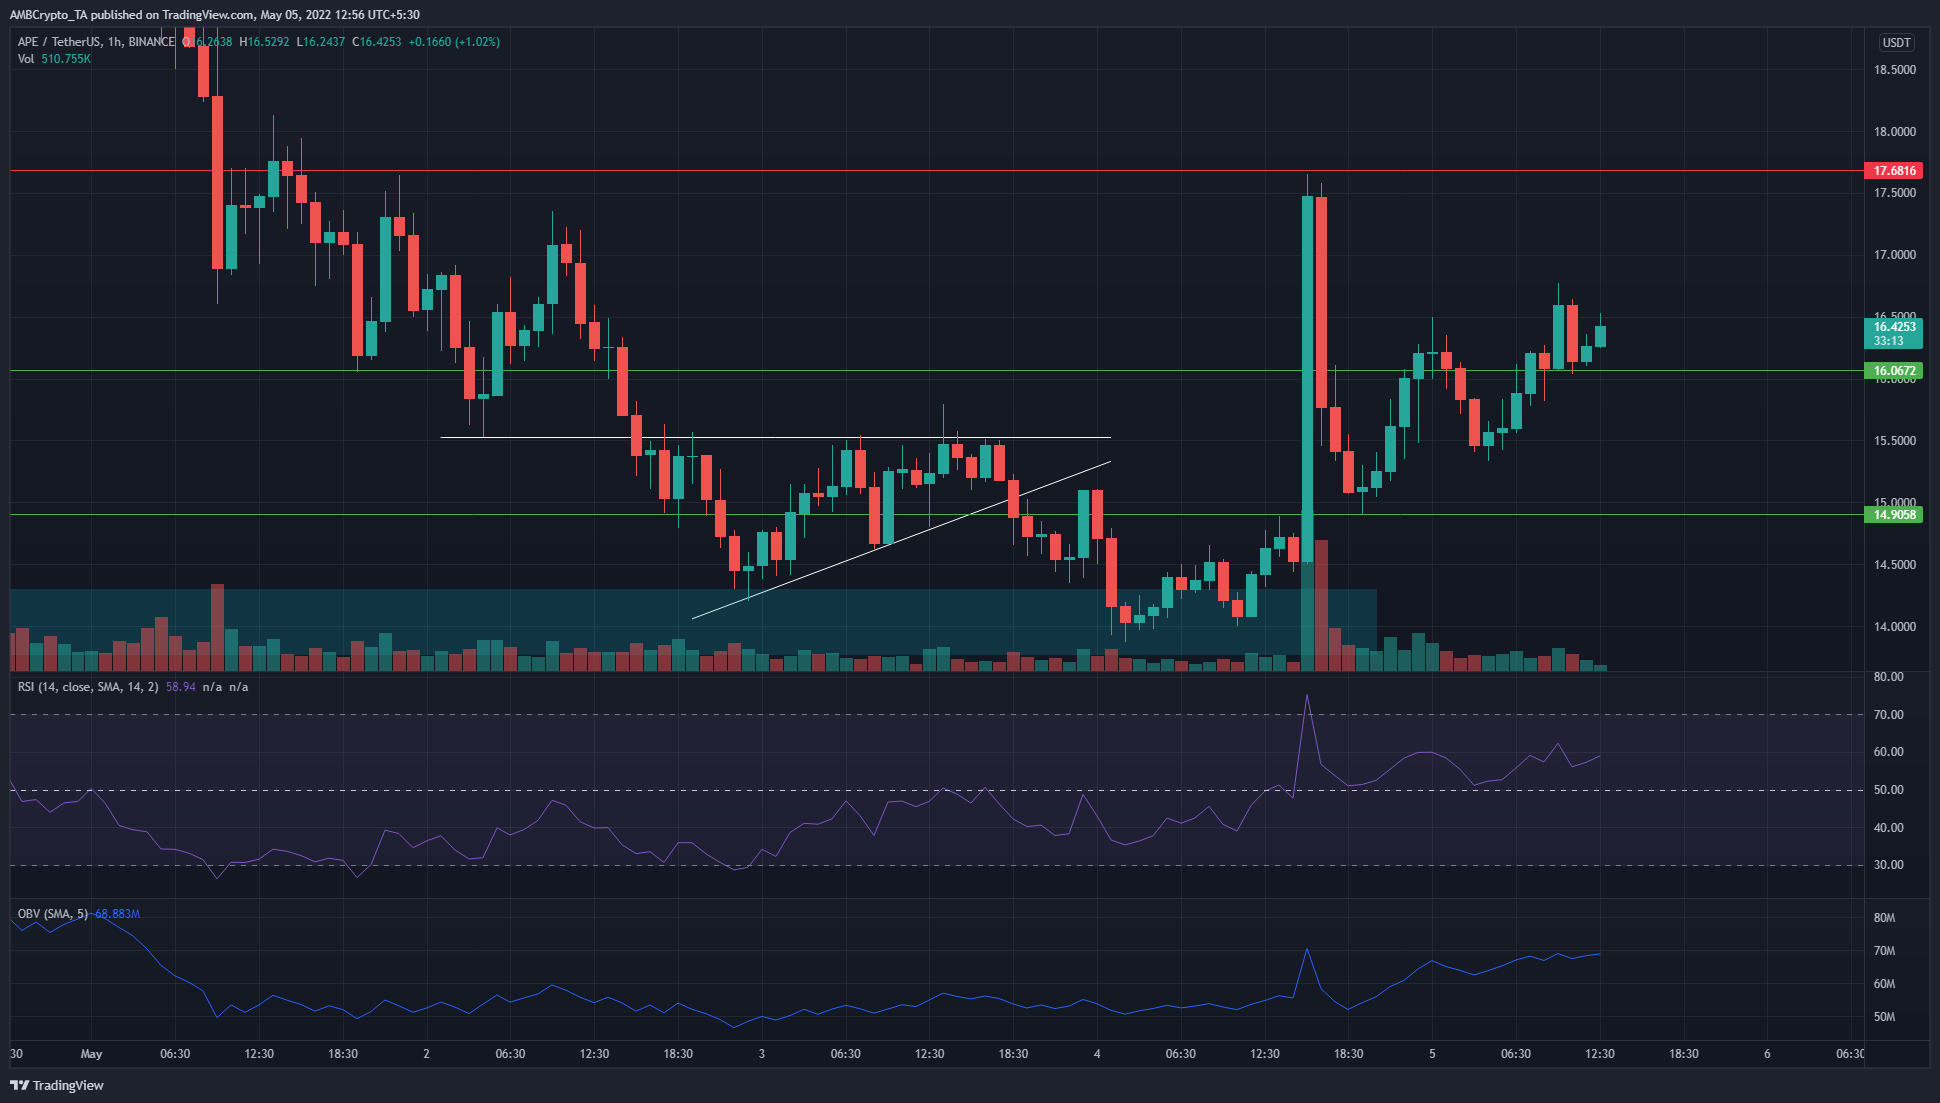
APE has been on a strong downtrend after setting an ATH at $27.6. Multiple levels of support were broken on the way down to $14, which was a demand zone (cyan box). In the past week, the price formed a descending triangle pattern after a downtrend and broke out to the downside. However, it found some demand at $14.
In March and April, APE appeared to form a range from $10.8 to $14.5, and a revisit of the former range highs sparked a strong rally for APE, pushing it back above $16.
The RSI showed bullish momentum as it continued to remain above the neutral 50 line. The OBV has also been on a steady uptrend in the past two days, which indicates that the rally from the zone of demand has steady demand behind it.
Zcash (ZEC)
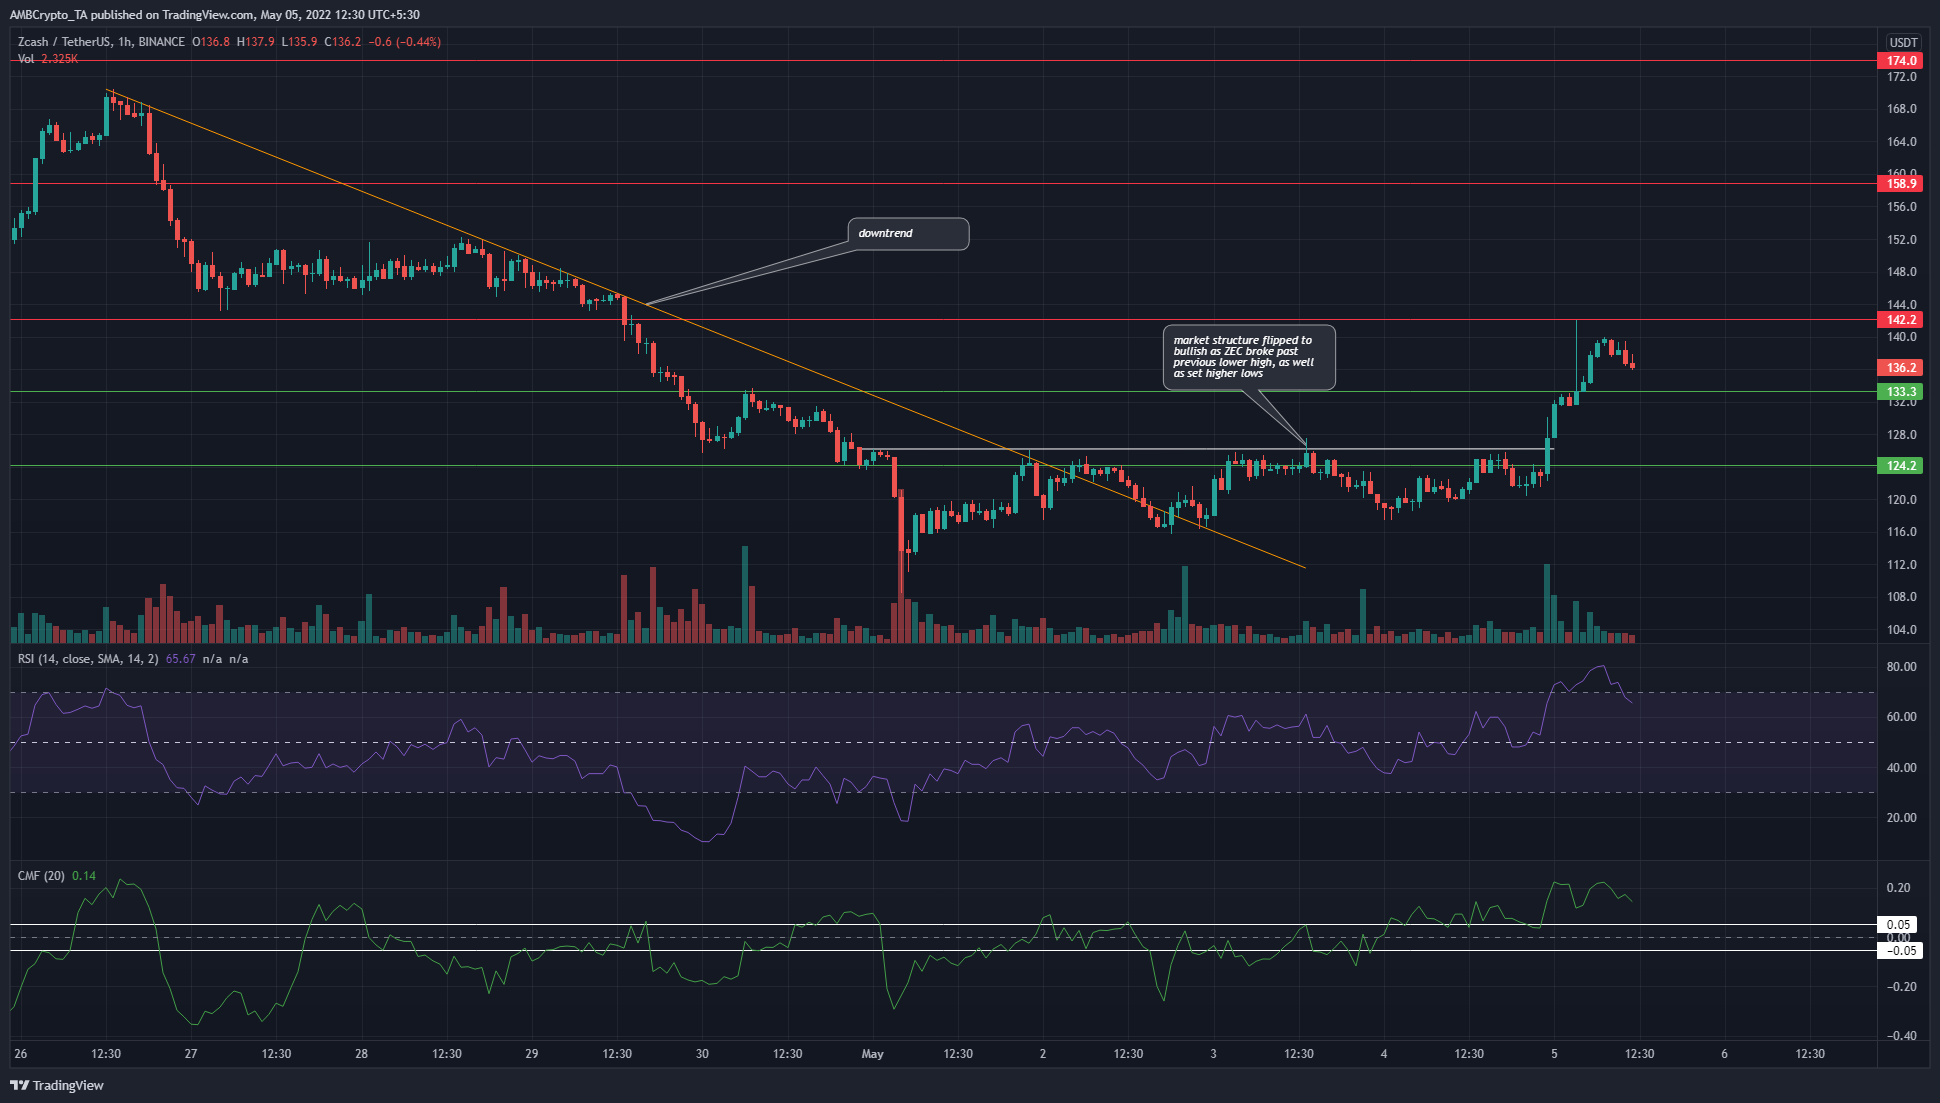
On the lower timeframes, ZEC has been in a downtrend after the rejection at the $170 mark, for the second time, towards late April. On a higher timeframe, it can be seen that ZEC was on a downtrend since the beginning of April.
At the time of writing, the price broke out past the downtrend’s recent lower highs (white) and was also trading above the $133 level. The RSI showed strong bullish momentum, while the CMF also showed heavy buying pressure over the past couple of days.