Polkadot, VeChain and Tron Price Analysis: June 21

With the Chinese mining crackdown and anticipated regulatory scrutiny, Bitcoin experienced a drop of 7% in the last 24 hours. Other altcoins too have been trading in a bearish zone. DOT was down by 10.10%, followed by Tron and VeChain at 9.2% and 8.8% respectively.
Polkadot (DOT)
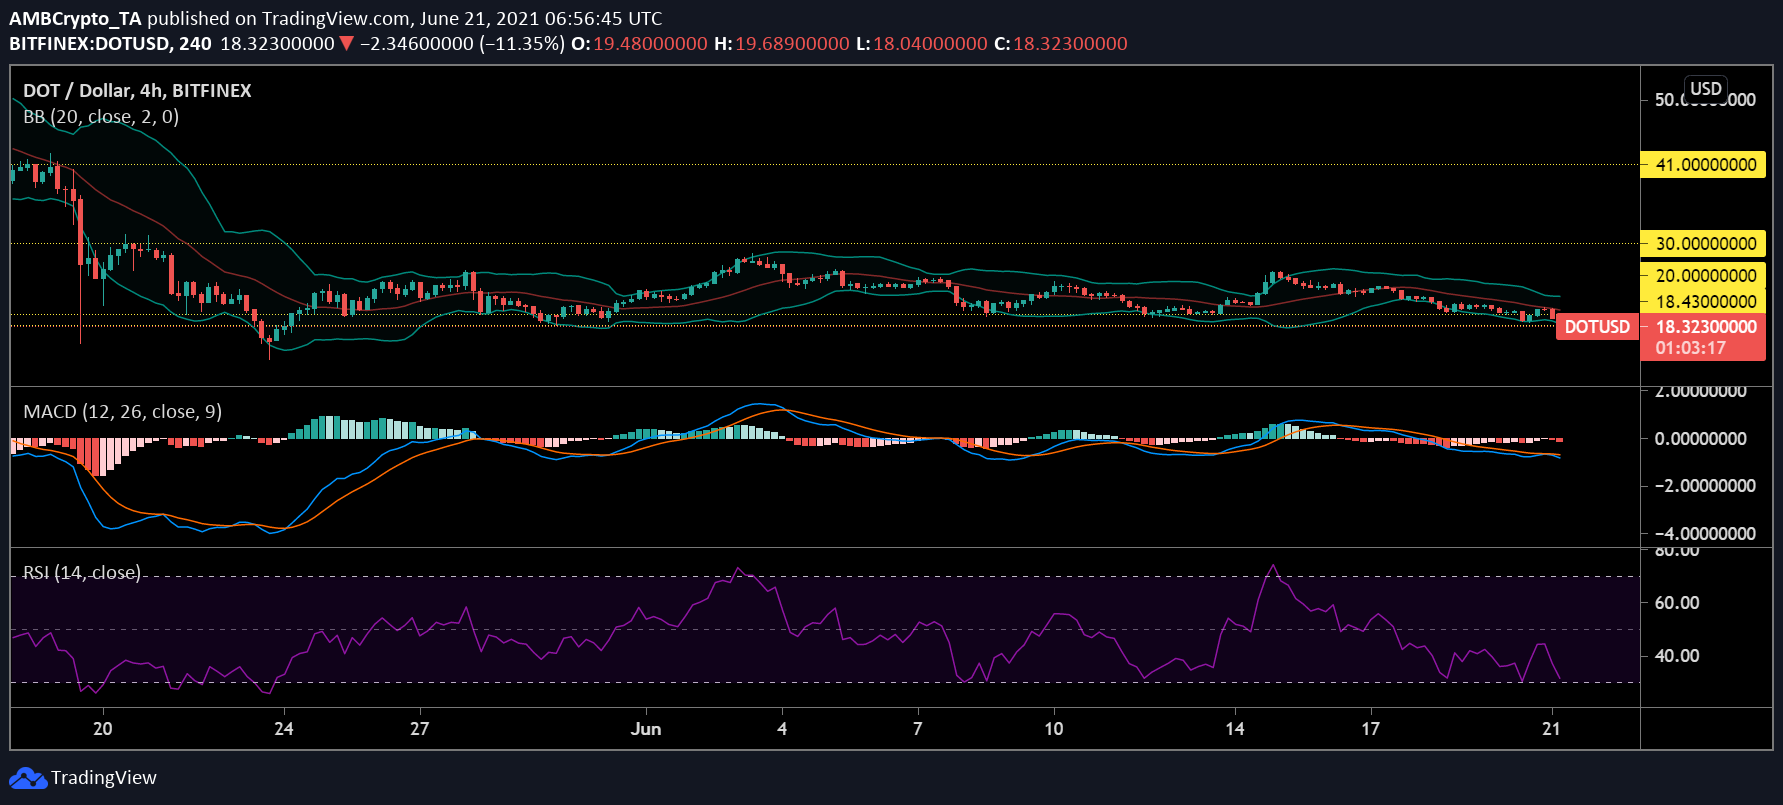
Over the past two weeks, DOT mainly showed sideways movements across the charts, and in the last 48 hours, the coin traded below the $20 support level. The alt was trading in red and was valued at $18.33 at the time of writing; this is the lowest that the coin has dropped to in the month of June.
Bears exerted dominance at press time as indicated by MACD histograms; the onset of a bearish signal took place on June 16. If DOT continued to move southward, the next support level would be at $16. There might not be any major price fluctuations, however, the mouth of Bollinger Bands appeared to diverge slightly so some volatility might be expected.
Relative Strength Index demonstrated that the indicator is almost about to touch the 30-mark signaling that the alt was moving towards the oversold zone.
VeChain (VET)
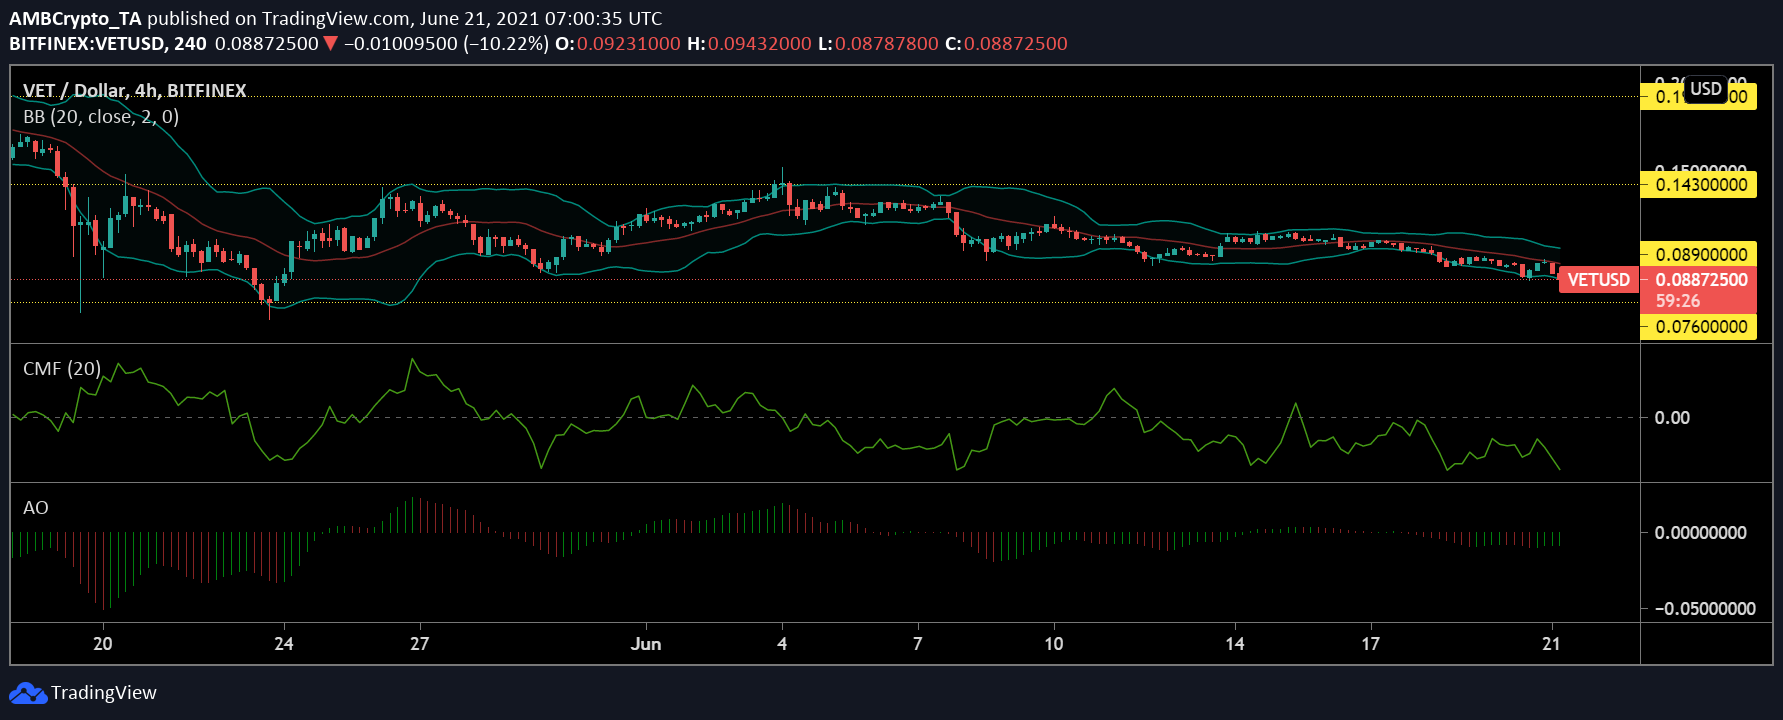
VET tested the $0.88 support level twice in the last week; a further dip in prices would mean that the coin will fall below that support level. At the time of writing, the coin was valued at $0.89.
Capital outflows have decreased over the past week and it still continues to dip as indicated by Chaikin Money Flow. Price volatility looked unlikely as Bollinger Bands remained convergent for the last 48 hours.
Interestingly, Awesome Oscillator depicted the beginning of bullish momentum for the alt, however, it had been marked by a few bearish trading sessions in the middle on June 20.
TRON
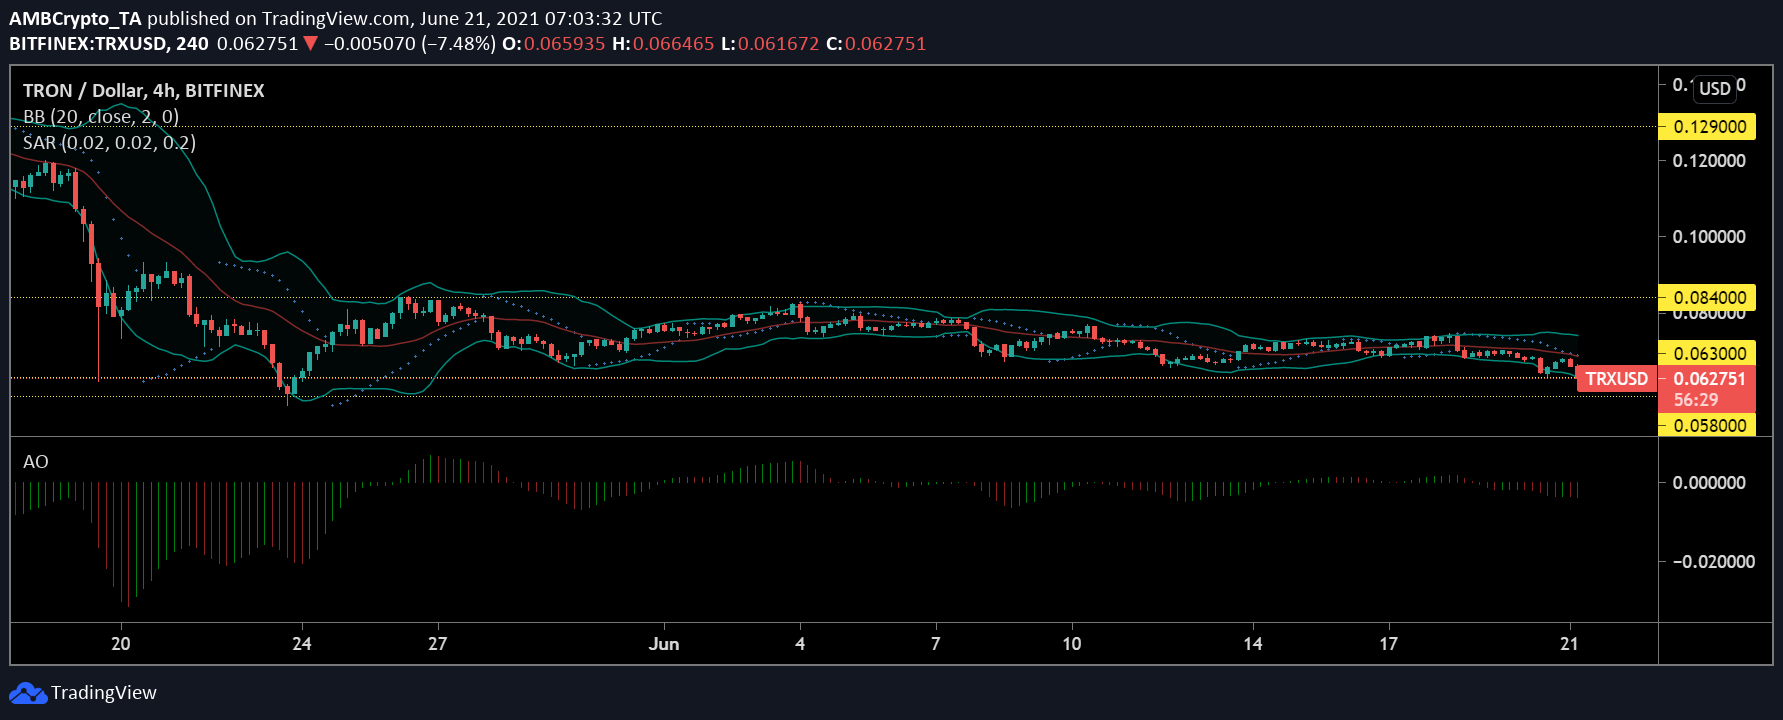
Just like every other cryptocurrency, Tron also struggled with its prices over the last few weeks. Even with mostly sideways movement on the charts, the coin succumbed to losses in the month of June. At press time, the alt was valued at $0.062 which was the lowest that it had reached since May 23.
Awesome Oscillator signaled that the alt has moved on a bearish momentum since June 18. Tron’s market capitalization fell by 8.08% in the last 24 hours, at the time of writing.
Despite lateral movements seen in the 4-hour trading chart, Parabolic SAR noted the beginning of a downtrend on June 18 and it continued to depict the same at press time. The widening of Bollinger Bands indicated that price volatility can be witnessed over the next trading sessions.